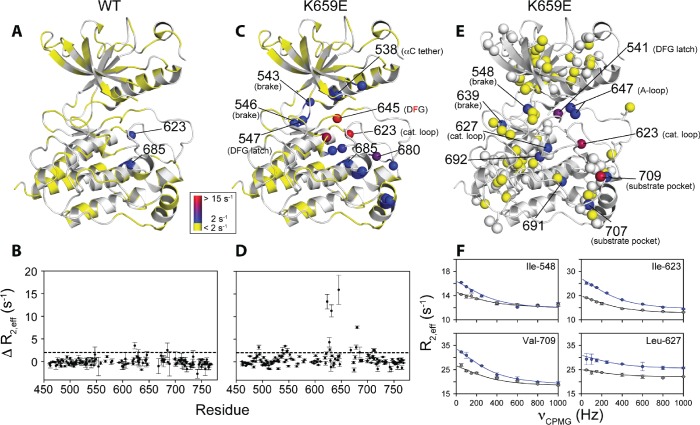
Figure 10. Comparison and quantification of microsecond-to-millisecond dynamics for wild-type and K659E FGFR2K.
(A–D) ΔR2,eff15N CPMG relaxation dispersion values for WT (panel A, B) and K659E mutant (panel C, D) plotted onto unphosphorylated WT FGFR1K (PDB ID: 3KY2 [Bae et al., 2010]) note that the residue numbering convention corresponds to that of FGFR2K. Significant dispersions (>2 s−1) are represented by the dotted line on each ΔR2,eff plot as a function of residue (panels B and D). All 15N CPMG data were acquired at a 1H frequency of 600 MHz. (E) Results from 13C multiple quantum CPMG relaxation dispersion experiments acquired at 800 MHz are plotted onto the unphosphorylated WT FGFR1K structure (PDB ID: 3KY2). The ΔR2,eff13C values are shown for Ile, Leu, and Val methyl groups (spheres). (F) CPMG dispersion curves for select residues at 800 MHz (blue) and 600 MHz (black). The lines represent a globally fit kex value equal to 2000 ± 500 s−1. For panels A, C, and E, significant dispersions (>2 s−1) are represented on a scale from blue to red with dispersions below 2 s−1 shown in yellow. White regions (A and C) or white spheres (E) indicate unassigned or unresolved residues.

