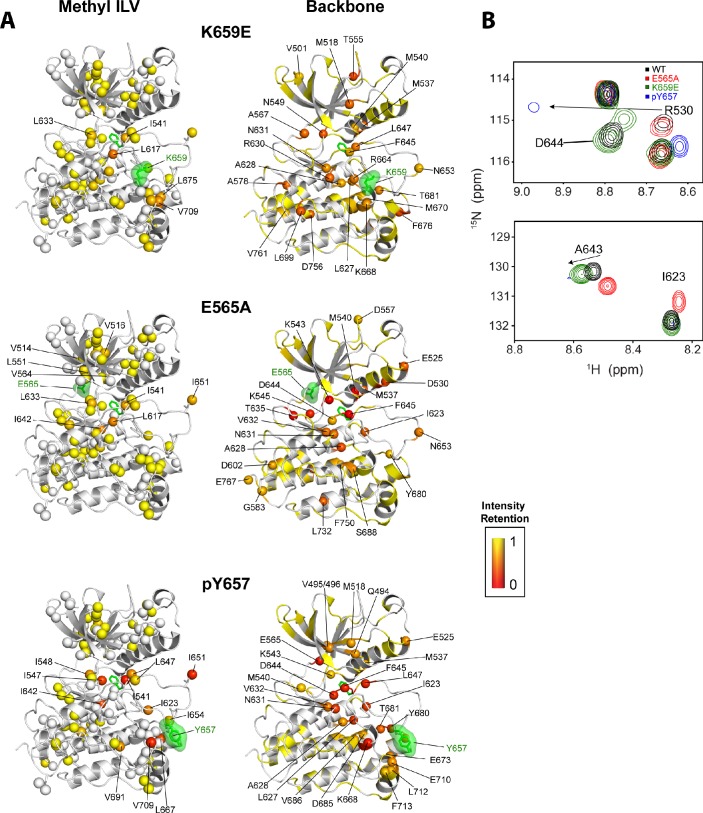
Figure 11. Intensity retentions of phosphorylated Y657 WT FGFR2K and pathogenic mutants K659E and E565A.
(A) Intensity retentions from 1H/13C HMQC and 1H/15N TROSY-HSQC spectra for Ile, Leu, and Val methyl groups (left column) and backbone (right column) of K659E (top), E565A (middle), and phosphorylated Y657 (bottom) relative to unphosphorylated WT FGFR2K. Intensity retentions were calculated by dividing the peak intensities of each mutant and phosphorylated WT protein by those of the WT. The site of mutation or phosphorylation is shown as a green surface. The side chain phenylalanine (F645) in the DFG motif is also depicted with green sticks in each structure to highlight its involvement in the allosteric pathway. All marked residues on the structures corresponding to the Ile, Leu, and Val methyl group data had intensity retentions below 0.8. Similarly, all residues marked and represented as spheres for the backbone data indicate intensity retentions below 0.8. The intensity retentions are represented on a color scale (red to yellow) from 0 to 1 where 1 represents full retention and 0 represents a complete loss of signal. (B) Overlay of 1H/15N TROSY-HSQC spectra for unphosphorylated WT, mono-phosphorylated Y657, E565A, and K659E showing the diminished or loss of peak intensities for phosphorylated Y657 and/or E565A. The top overlay highlights residue D644 within the DFG motif, which is present for WT and K659E, but missing from the phosphorylated Y657 spectrum and significantly diminished for E565A. Note that at a lower contour cutoff, D644 is observed for E565A. R630 is also shown in this same panel and indicates a large chemical shift perturbation for K659E that was previously reported for the pathogenic mutants characterized at K659 (Chen et al., 2013). The bottom spectral overlay in panel B shows a similar trend for residue G643. Here, signal strength for phosphorylated Y657 FGFR2K is significantly diminished, while E565A shows a chemical shift perturbation without a loss in signal intensity.

