. 2017 Feb 6;6:e21137. doi: 10.7554/eLife.21137

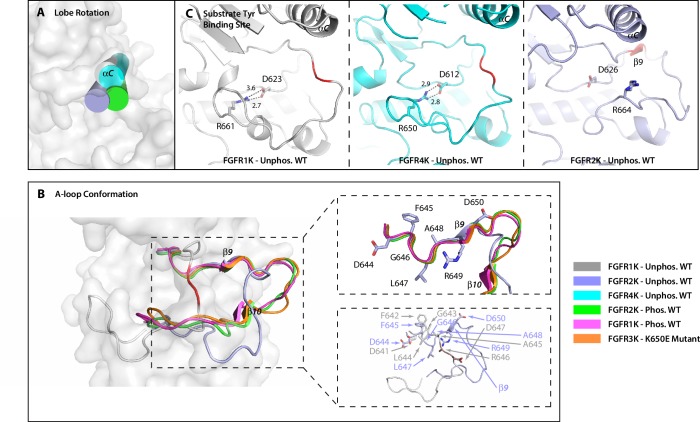
Figure 2. The crystal structure of unphosphorylated WT FGFR2K is in a partially active conformation.

(A) The orientation of the αC helix (rendered as a cylinder) in the crystal structure of unphosphorylated WT FGFR2K is similar to those seen in crystal structures of the A-loop phosphorylated FGFR1K and FGFR2K. (B) The conformation of first seven residues of the A-loop (DFGLARD) of the unphosphorylated WT FGFR2K resembles those of phosphorylated activated FGFR1K and FGFR2K. Note that as in these latter phosphorylated activated FGFRK structures, the unphosphorylated FGFR2K features the β9 strand which pairs with the catalytic loop. (C) The substrate tyrosine binding site in the unphosphorylated FGFR2K is fully accessible which is in stark contrast to that in the unphosphorylated FGFR1K and FGFR4K in which a prominent salt-bridge between an FGFR-invariant arginine (R661 in FGFR1K, R664 in FGFR2K and R655 in FGFR4K) and the catalytic base (D623 in FGFR1K, D626 in FGFR2K and D617 in FGFR4K) blocks the active site. Hydrogen bonds are shown as dashed lines with the distances given in Å. The A-loop section in the unphosphorylated FGFR1K and FGFR2K that forms a β9 strand upon A-loop phosphorylation is highlighted in red. Note that the β9 strand is already present in the unphosphorylated FGFR2K implying that this structure is in a partially active state.

DOI: http://dx.doi.org/10.7554/eLife.21137.004

Figure 2.

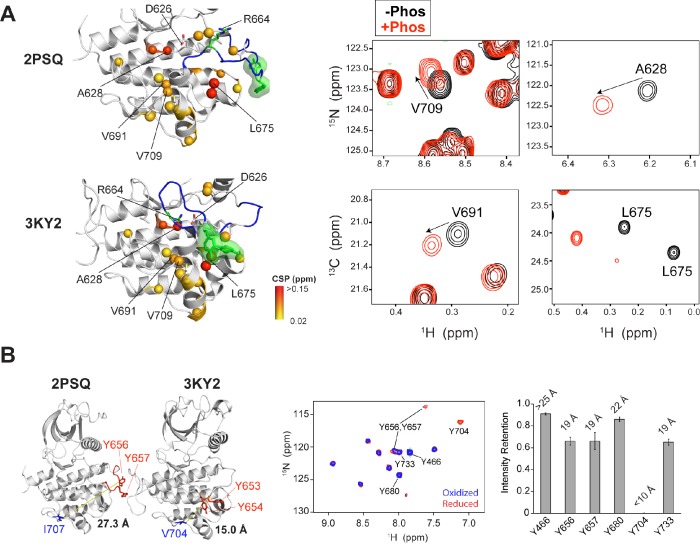
Figure 2—figure supplement 1. PRE experiments and chemical shift analysis provide evidence of an FGFR1K-like autoinhibited A-loop conformation for FGFR2K.

Figure 2—figure supplement 1.

(A) Analysis of chemical shift changes between unphosphorylated and Y657 phosphorylated FGFR2K. Amide 15N and ILV methyl 13C chemical shift perturbations (CSPs) greater than 0.02 ppm are plotted on the structures of FGFR1K (PDB ID: 3KY2) and FGFR2K (PDB ID: 2PSQ) (left panel). The A-loop is colored in blue and the two A-loop tyrosine residues are shown in green. The colored spheres show the magnitude of chemical shift perturbations introduced upon phosphorylation as indicated in the figure. The right panels of (A) show example 1H/15N HSQC and 1H/13C HMQC spectral regions highlighting perturbed residues in the absence (black) and presence of A-loop phosphorylation (red). (B) Distances from the Cγ atoms of V704 and I707 to the nitrogen atom of Y656 in FGFR1K (PDB ID: 3KY2) and FGFR2K (PDB ID: 2PSQ) structures, respectively. The A-loop tyrosines are shown in red. The distance of the Cγ is an approximation for the position of the (1-oxyl-2,2,5,5-tetramethyl-3-pyrroline-3-methyl)-methanethiosulfonate (MTSL) nitroxide spin label. The middle panel of (B) shows 1H/15N HSQC correlation spectra of [15N-Tyr] I707C FGFR2K labeled with MTSL in the oxidized (blue) and reduced (red) forms. The right panel of (B) shows the intensity retention plot calculated by dividing the peak intensities in the oxidized form of MTSL with those of the reduced form. Calculated distances of the spin label to tyrosine residues are displayed on top of the bars. Residues Y704 and Y466 serve as internal distance calibration controls. Y704 completely disappeared in the presence of the oxidized label indicating its close proximity to MTSL (calculated distance <10 Å, actual distance =~7 Å) and Y466 retained an intensity retention above 0.9 indicating a distance greater than ~25 Å (actual distance =~46 Å in 3KY2). Y656 and Y657 showed intensity retentions of ~0.6, which corresponds to a distance of ~19 Å that is consistent with the A-loop packing against the C-lobe as observed in the autoinhibited crystal structures of FGFR1K (3KY2) and FGFR4K (4QQT).