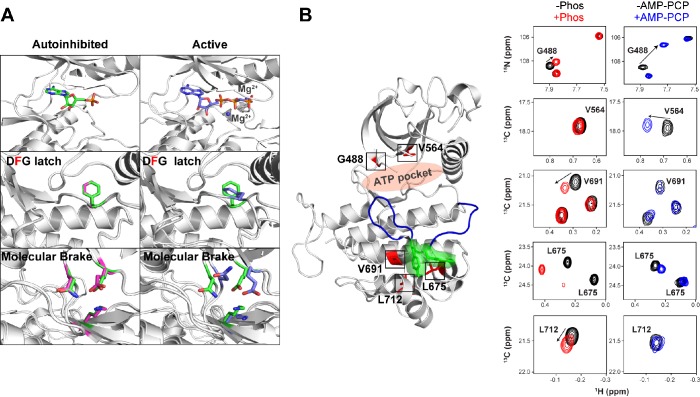
(
A) Comparison of structural changes induced upon AMP-PCP binding to the autoinhibited and activated conformations of FGFR1K. The top left and right panels show the difference between AMP-PCP visibility between the autoinhibited (green) (
Mohammadi et al., 1996b) and active (purple) forms (PDB ID: 2PVF) of the kinase domain. The lack of electron density for the β and γ phosphates and Mg
2+ suggests a relatively poor affinity for the nucleotide. Nevertheless, this autoinhibited structure is able to bind nucleotide yet does not undergo a conformational change to the active conformation. The middle left and bottom left panels show an overlay of unphosphorylated FGFR1K with (green) and without (magenta) nucleotide in the binding pocket (green). The middle right and bottom right panels show an overlay of unphosphorylated FGFR1K with nucleotide in the pocket (green) and the phosphorylated FGFR1K structure with nucleotide in the pocket (purple). The structural views of the molecular brake and DFG latch imply that the presence of nucleotide does not impact the conformations of these two key regions in the allosteric communication network. (
B) Comparison of chemical shift perturbations induced upon Y657 phosphorylation (left spectra) and AMP-PCP binding (right spectra). Highlighted peaks in the spectra are mapped onto 3KY2 in red to illustrate their proximity to Y656/Y657 (green) and the entire A-loop (blue). AMP-PCP binding resulted in large chemical shift changes around its binding site (G488 and V564), while changes induced by A-loop phosphorylation gave several changes within the C-lobe near the A-loop packing location.


