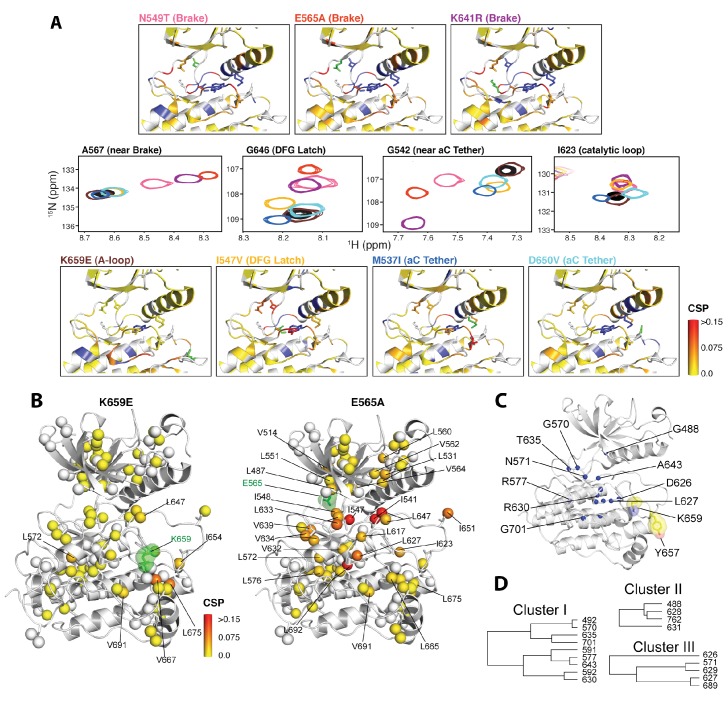
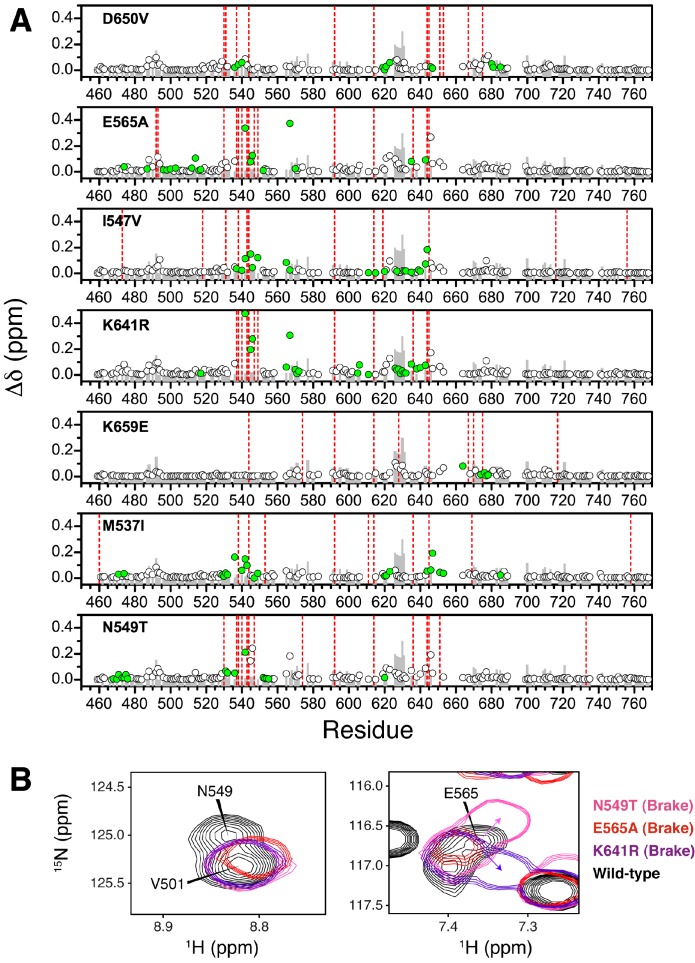
Figure 9. NMR chemical shift perturbation and CHESCA analysis for FGFR2K mutations.
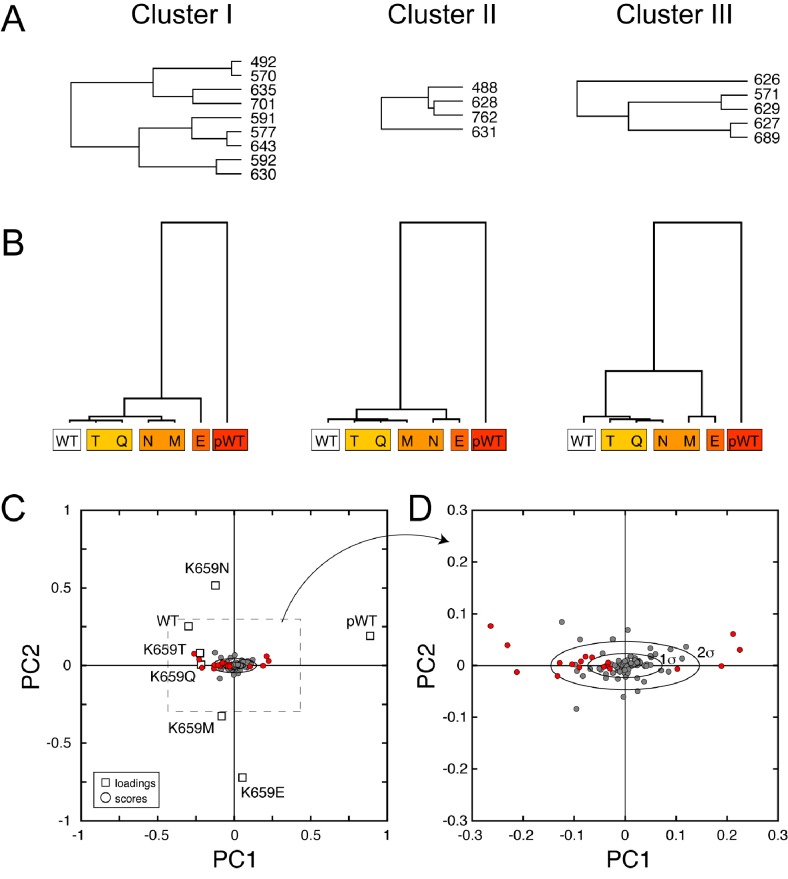
(A) 1H/15N correlation spectra are shown in the middle four panels for residues A567, G646, G542, and I623 located near the molecular brake, within the DFG latch, near the αC tether, and within the catalytic loop, respectively. The colors of this spectral overlay match to those of the seven mutants listed in the top three and bottom four panels. Perturbations are mapped onto the active WT FGFR2K structure (PDB ID: 2PVF [Chen et al., 2007]) with the magnitude of changes reflecting the difference between unphosphorylated WT FGFR2K and the respective activating mutation (red indicates the maximum perturbation, while yellow corresponds with no perturbation). Blue colored regions correspond to residues whose chemical shifts disappeared or shifted beyond detection for the given mutant. The mutated residue in each structure is colored green. (B) Ile, Leu, and Val chemical shift perturbations of K659E (left) and E565A (right) relative to those of unphosphorylated WT FGFR2K. The methyl perturbation sites shown in spheres are mapped onto the autoinhibited WT FGFR1K (PDB ID: 3KY2 [Bae et al., 2010]); note that the residue numbering convention corresponds to that of FGFR2K. White spheres correspond to residues unassigned or overlapped in the mutants. (C) Residues within the allosteric network identified using CHESCA are mapped onto the FGFR1K structure with a sphere at the backbone nitrogen position (PDB ID: 3KY2 [Bae et al., 2010]). The chemical shifts from a series of mutations at K659 (T, N, Q, M, E) and WT phosphorylated and unphosphorylated FGFR2K were used for the analysis. (D) Phylogenic tree showing the three separate clusters of residues with correlation coefficients |rij| = 0.97. Based on the similar functional network, these three clusters comprise the same allosteric network (Figure 9—figure supplement 2).


