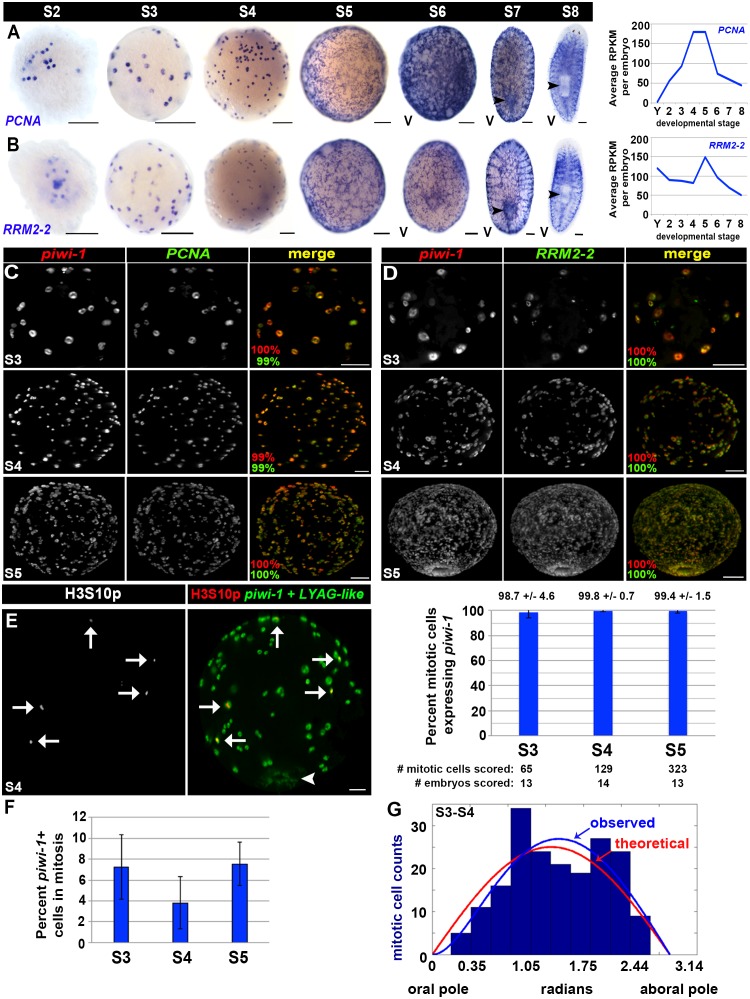
Figure 3. Cell cycle activity is restricted to the piwi-1+ compartment.
(A–B) Left: Colorimetric WISH depicting expression of PCNA (A) or RRM2-2 (B) during stages S2–S8. Right: Average RPKM values per embryo for PCNA (A) or RRM2-2 (B) in Y (yolk) and S2–S8. V, ventral. Scale: 100 µm. (C–D) S3 (top), S4 (middle) and S5 (bottom) embryos costained with piwi-1 (red) and PCNA (green [C]) or RRM2-2 (green [D]) riboprobes. The percentage of piwi-1+ cells coexpressing the indicated cell cycle marker (red) and the percentage of PCNA+ or RRM2-2+ cells coexpressing piwi-1 (green) appear in the lower left corner of merged images. Scale bars: 100 µm. (C) S3: n = 273 cells, n = 6 embryos. S4: n = 1,267 cells, n = 4 embryos. S5: n = 734 cells, n = 3 embryos. (D) S3: n = 130 cells, n = 4 embryos. S4: n = 1,295 cells, n = 5 embryos. S5: n = 350 cells, n = 3 embryos. (E) Mitotic activity is restricted to the piwi-1+ cell compartment in S3–S5 embryos. Left: S4 embryo costained with piwi-1 and the embryonic pharynx marker LYAG-like (both in green) and antibodies against the mitotic epitope H3S10p (red). White arrows: dividing blastomeres. White arrowhead: temporary embryonic pharynx. Scale bar: 100 µm. Right: Bar graph depicting the percentage of mitotic cells scored that expressed piwi-1 in S3–S5 embryos. (F) The mitotic index for the piwi-1+ cell compartment did not vary significantly during S3–S5. Average percentage of piwi-1+ cells in mitosis during S3–S5. Error bars represent the standard deviation of the mean. Observed distribution of mitotic (piwi-1+, H3S10p+) cells in S3-–S4 embryos (blue bars) along the oral-aboral axis (0–3.14 radians). Using the function derived with maximum likelihood estimation for the piwi-1+ cell distribution, (1-exp(-θ/θ’))*sin(θ) (blue line), and simulations using equivalent sample sizes, the optimal θ’ was calculated to be 0.58 ± 0.33, and was 50-fold more likely to explain the observed trend than a simple normal distribution, sin(θ), where θ’=0 (red line). S3: n = 82 mitotic cells, n = 18 embryos. S4: n = 110 mitotic cells, n = 8 embryos. (G) Mitotic cell positions are not stereotyped in early embryos.

