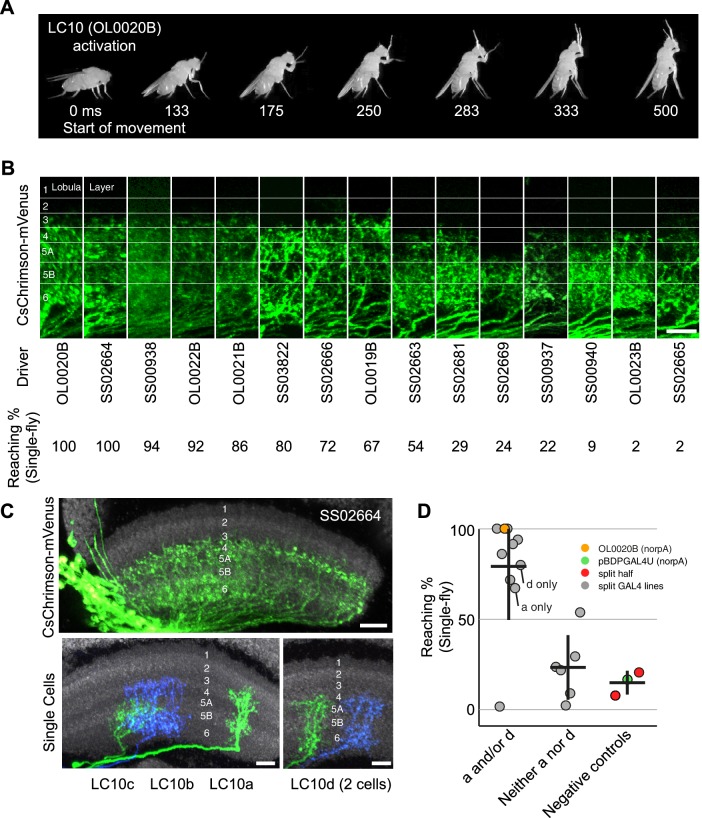
Figure 10. Reaching behavior resulting from activation of LC10 subtypes.
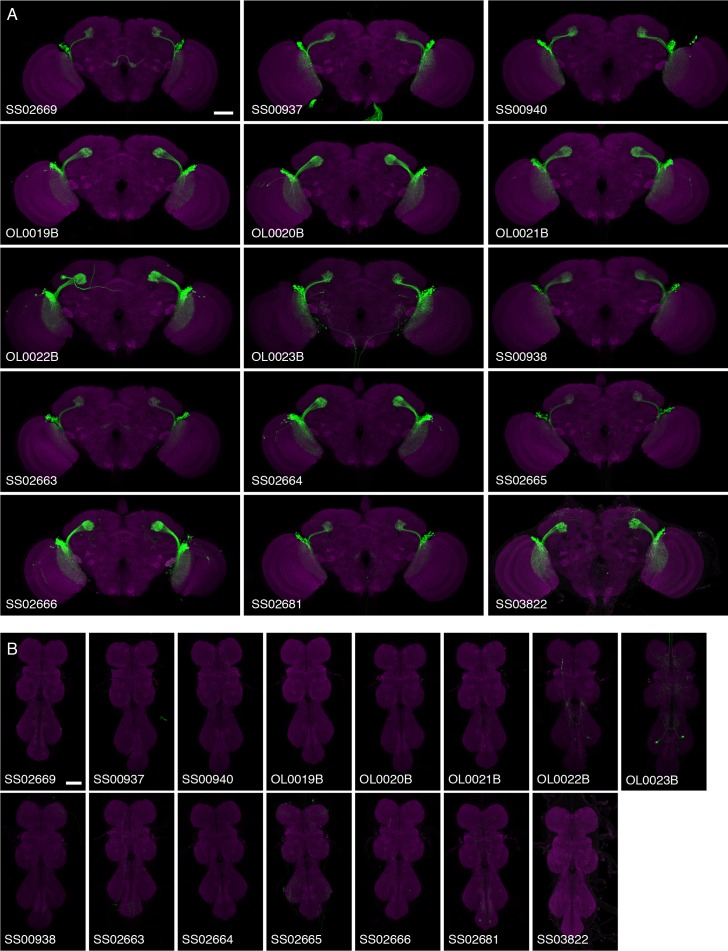
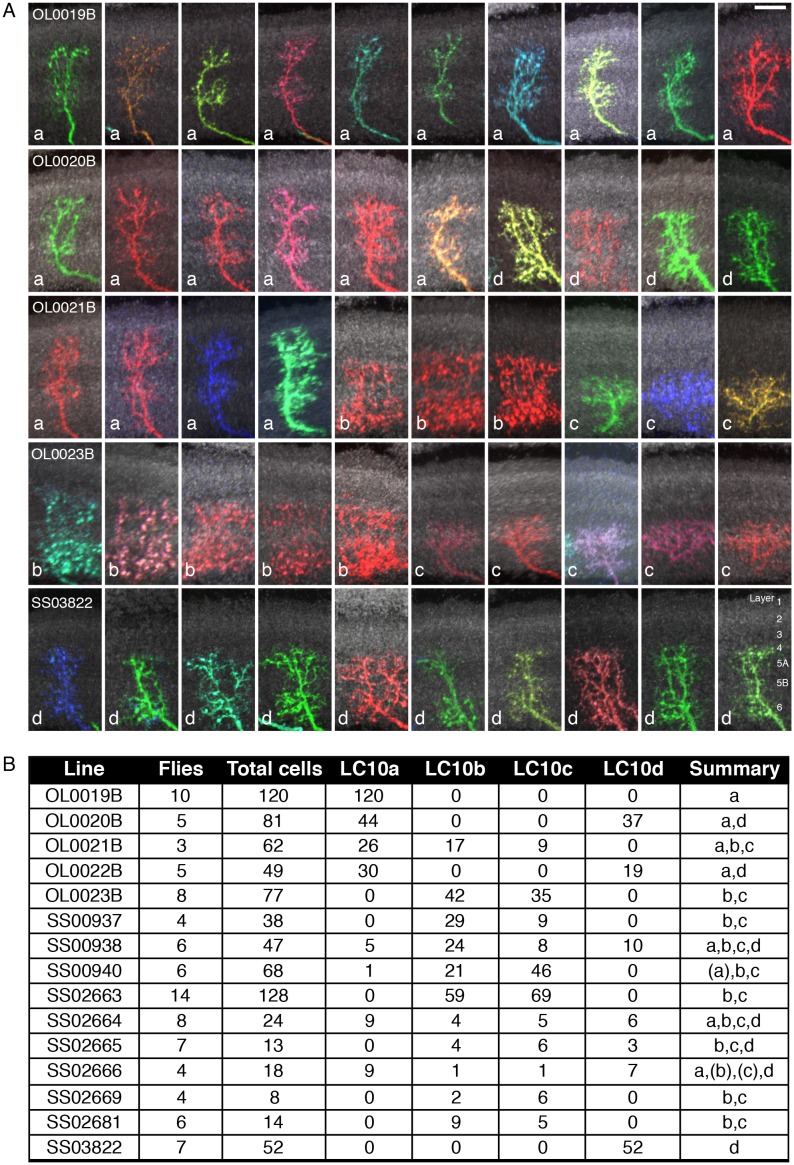
(A) Representative video images of a fly exhibiting reaching behavior in the single-fly assay. Time stamps indicate milliseconds (ms) after the start of reaching. (B) Comparison of lobula layer patterns and penetrance of reaching upon optogenetic activation for 15 LC10 split-GAL4 lines. The images show reconstructed views of CsChrimson expression in the lobula (generated using Vaa3D and manually aligned using the anti-Brp reference marker). Approximate layer positions are indicated on the left. Scale bar represents 10 µm. CsChrimson expression using two additional LC10 driver lines (SS00941 and SS00942) resulted in unexpected uncoordinated behaviors in response to optogenetic activation that precluded analyses of reaching behavior. These lines, which are related as they only differ from each other in the insertion site of the AD hemidriver (see Supplementary file 1B), were therefore excluded from further analyses. (C) Single cell labeling reveals subtype expression patterns of LC10 driver lines. Overall lobula expression of an LC10 split-GAL4 line (SS02664) (top panel; displayed as in B) and examples of MCFO labeled single cells from this line (bottom panels) are shown. LC10 subtypes (indicated below the images) of single cells were assigned based on layer pattern, arbor size and shape as follows: LC10c cells mainly arborize in layer Lo5B with some processes in the adjacent layers. LC10a cells also have arbors in Lo5B, but differ from LC10c by having additional processes in the more distal layers Lo2, Lo3 and Lo4. LC10b and LC10d differ from LC10a and LC10c by having major arbors in Lo6 and only few processes in Lo5B. Their distal arbors reach Lo4. LC10b cells are wider than LC10d cells and show many small varicosities (presumably presynaptic sites; compare Figure 5—figure supplement 2E) in Lo6. LC10 neurons also differ in their axonal paths in the AOTu: LC10a and LC10d axons run both dorsally and ventrally, and LC10b and LC10c only ventrally (Figure 3G; also see Figure 10—figure supplement 1). Scale bars represent 10 µm. (D) Reaching penetrance observed upon activation of the LC10 split-GAL4 drivers and various control lines in the single-fly assay. Split-GAL4 drivers are grouped by expression patterns in the LC10 subtypes: either subtype a and/or d, or neither a nor d. Driver lines were included in the ‘a and/or d’ category if two or more cells of these types were identified in MCFO experiments (see Figure 10—figure supplement 2). Colors representing various controls and split-GAL4 driver lines are the same as those in Figure 9.


