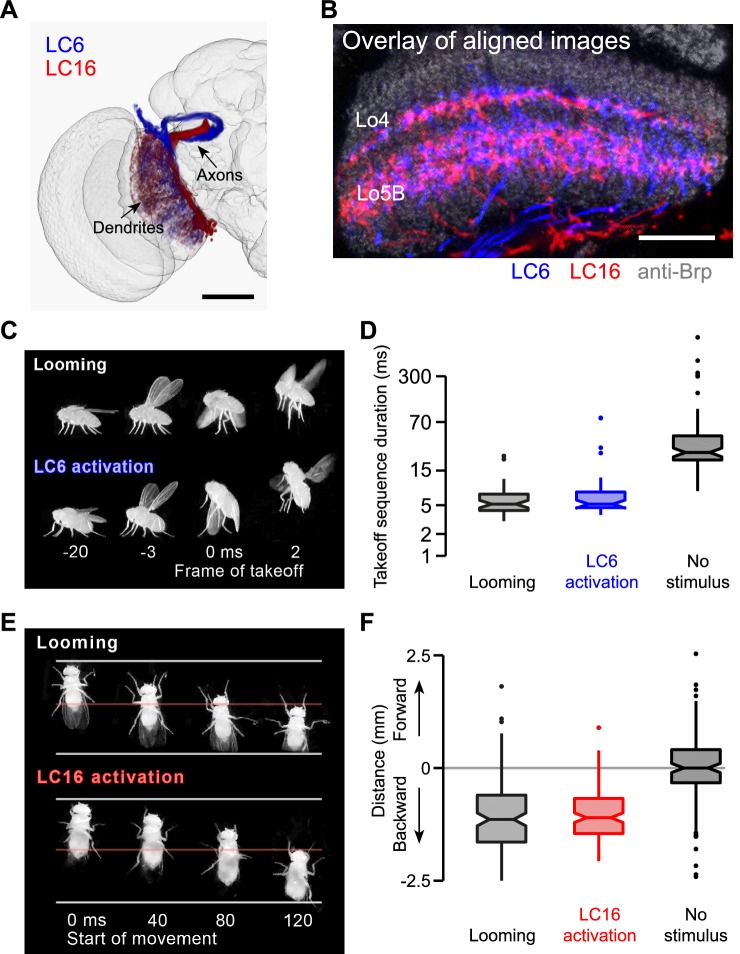
Figure 11. LC6 and LC16 activation behaviors resemble avoidance responses evoked by visual looming.
(A) LC6 and LC16 project to adjacent, non-overlapping target glomeruli. The image was generated using a 3D image rendering software (FluoRender) (Wan et al., 2012) on aligned confocal images. (B) LC6 and LC16 have similar layer patterns in the lobula. An overlay of substack projections of aligned image stacks is shown. Anti-Brp reference marker is in grey. (C) Representative video images from the single-fly assay showing that a looming stimulus and LC6 activation evoke very similar coordinated behavioral sequences, which include wing elevation, middle leg extension and initiation of flight. Time stamp is set at 0 ms for the frame of takeoff. Negative and positive values are for frames before and after takeoff, respectively. (D) Notched box plots showing the duration of the takeoff sequence measured as the time from the first moment of wing movement to the last moment of tarsal contact with the ground after the stimulus (Mann-Whitney test, p=0.29 between looming and LC6 activation, and p<0.001 between LC6 activation and no stimulus). (E) Representative video images from the single-fly assay showing that a looming stimulus and LC16 activation evoke very similar backward walking behaviors. Time stamp is set at 0 ms for the start of backward walking. (F) Total distance flies walked on the platform of the single-fly assay. Positive and negative values are for forward and backward walking, respectively (Mann-Whitney test, p=0.71 between looming and LC16 activation, and p<0.001 between LC16 activation and no stimulus). Scale bars represent 50 µm (A) or 20 µm (B).


