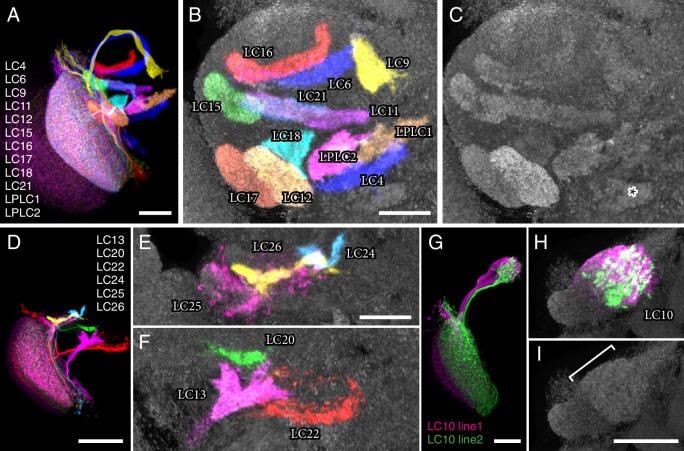
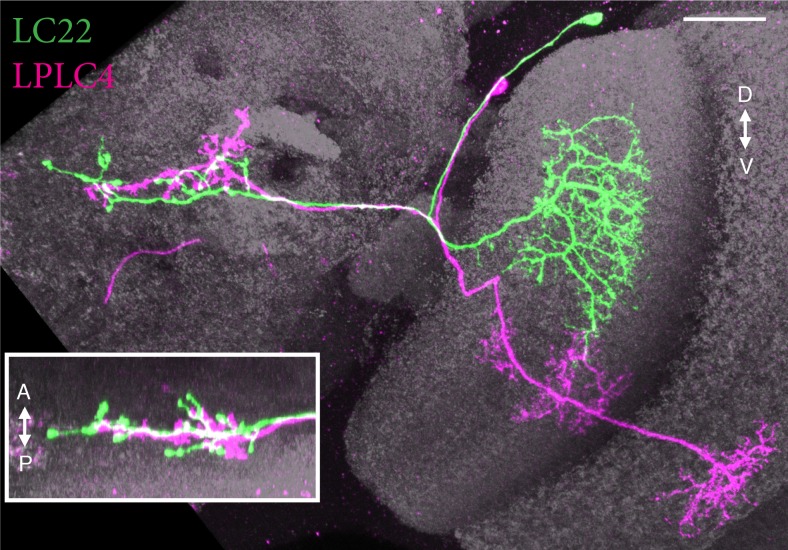
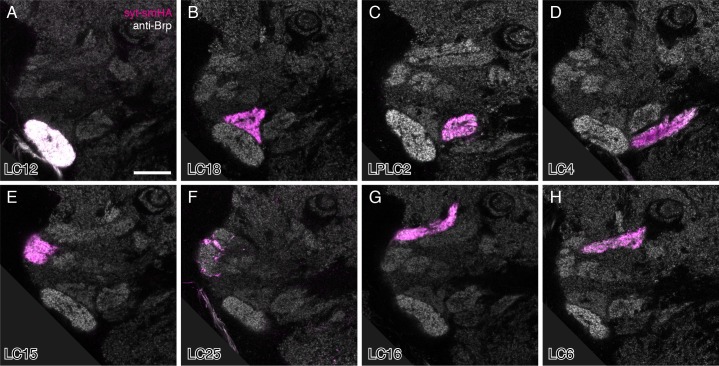
Figure 3. LC neuron terminals in the central brain are organized into distinct neuropil structures.
(A) Illustration of the projection patterns of 12 LC cell types that project to major optic glomeruli in the PVLP (or in the PVLP/PLP boundary region). Image is a substack maximum intensity projection of a composite image stack generated from 12 computationally aligned image stacks (one for each cell type). Images were manually segmented to exclude background and some off-target cell types. Unedited pre-alignment stacks are available from www.janelia.org/split-GAL4. For details of genotypes see Supplementary file 1D. (B,C) Target regions of the LC neurons shown in (A) match the optic glomeruli pattern in the PVLP. Target regions of different LC cell types were labeled by split-GAL4 driven expression of a presynaptic marker (pJFRC51-3XUAS-IVS-syt::smHA in su(Hw)attP1, detected using anti-HA antibody labeling). Images for different cell types were edited and combined as described above. The anti-Brp pattern of the standard brain used for alignment is shown in grey. (C) Pattern of optic glomeruli revealed by anti-Brp labeling. Image is the same as the anti-Brp channel of the overlay shown in (B). Note the close correspondence of the presynaptic terminals of LC cell populations and optic glomeruli. Asterisk marks a large synapse rich (based on anti-Brp labeling) glomerular structure in the PLP that appears to be the target of several columnar VPNs that were not included here since we considered them to be primarily associated with the lobula plate, not the lobula (though some have lobula branches). As an example, one cell of one such type (LPC1) is shown in Figure 1—figure supplement 1E. LPC1 was also identified by (Panser et al., 2016). (D–F) Overlays generated as in (A) and (B) showing the projection patterns (D) and target regions (E,F) of additional LC neurons with terminals in the posterior PVLP and in the PLP. LC24, LC25 and LC26 projected to locations close to those of LC15, LC6 and LC16 but slightly more posterior and might also slightly overlap with each other. In particular, LC25 was unusual in that its terminals spread along the surface of, and perhaps partly overlapped with, the LC15 target region and other adjacent glomeruli (E and Figure 3—figure supplement 2). Similarly, part of the boundary of the LC22 target region, as visualized by synaptic marker expression in LC22 cells, was less well defined than the boundaries of most other glomeruli (F). The LC22 glomerulus also appears to overlap with the target region of a second columnar VPN: stochastic labeling experiments revealed an additional LPLC-like cell type (distinct from LPLC1 and LPLC2 and tentatively named LPLC4 in agreement with [Panser et al., 2016]) that projects to the same approximate location as LC22. While we have yet to generate specific split-GAL4 drivers for this additional LPLC cell type and therefore did not further characterize these neurons here, their overlap with LC22 terminals was directly confirmed by co-labeling of single cells of both types in the same specimen (Figure 3—figure supplement 1). (G–I) LC10 neurons project to the large subunit of the AOTu. Overlays (generated as described above) showing cell shapes (G) and presynaptic sites (H) of LC10 cells labeled by two different split-GAL4 driver lines. LC10 neurons showed two distinct general projection paths with axons entering the large subunit of the AOTu from both dorsally and ventrally (magenta cells) or only from ventrally (green cells), in agreement with previous findings suggesting the existence of LC10 subtypes (Otsuna and Ito, 2006). (I) Anti-Brp reference pattern alone. The LC10 terminals are in a distinct large subcompartment (white bracket) of the AOTu. The AOTu also includes smaller subunits adjacent to this LC10 target region. Scale bars represent 30 µm (A,G,I), 20 µm (B,E) or 50 µm (D).


