. 2016 Dec 28;5:e21022. doi: 10.7554/eLife.21022

Figure 9. Experiments with additional LC6 and LC16 driver lines confirm the activation phenotypes of these cell types.

(A,B) Behavioral penetrance for different controls and multiple split-GAL4 driver lines for (A) jumping (flies that jumped within 200 ms of stimulation onset) with LC6 controls based on the OL0077B driver line and (B) backward walking and turning with LC16 controls based on the OL0046B driver line. Each dot represents an experiment done with a different genotype: orange, LC neuron activation in blind norpA flies that also carry an LC6 (A) or LC16 (B) split-GAL4 line; green, pBDPGAL4U control in blind norpA flies; blue, flies reared on food without supplemental retinal; red, split-GAL4 DBD or AD halves; grey, genetically distinct split-GAL4 driver lines with targeted expression in LC6 (A) or LC16 (B). Horizontal and vertical lines indicate mean and standard deviation, respectively, for the control group and split-GAL4 group. The genotypes of the driver lines, behavioral penetrance and total trial and fly counts are listed in Supplementary file 1B. Expression patterns of the split-GAL4 driver lines used are shown in Figure 9—figure supplement 1.

DOI: http://dx.doi.org/10.7554/eLife.21022.023

Figure 9.

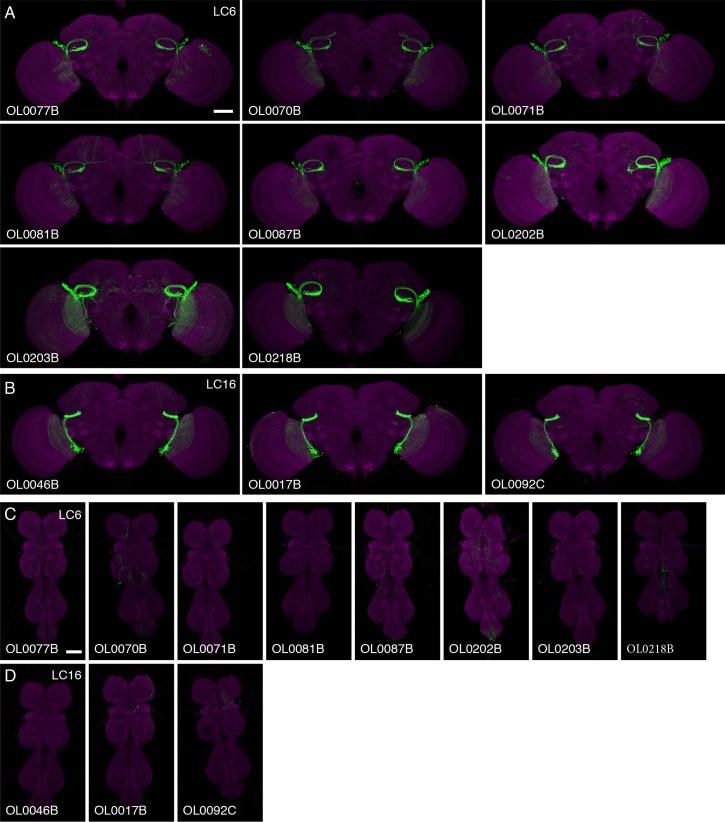
Figure 9—figure supplement 1. Expression patterns of multiple split-GAL4 driver lines for LC6 and LC16.

Figure 9—figure supplement 1.

Brain (A,B) and VNC (C,D) expression patterns of split-GAL4 drivers for LC6 (A,C) and LC16 (B,D). Split-GAL4 driven expression of 20xUAS-CsChrimson-mVenus (insertion in attP18; visualized using anti-GFP antibody labeling; green) and a neuropil marker (anti-Brp, magenta) are shown. Imaging parameters and brightness or contrast adjustments were identical within each brain/VNC pair but not across all images. OL0077B and OL0046B images are the same as those shown in Figure 2 and Figure 2—figure supplement 1. Scale bar represents 50 µm. Original confocal stacks are available from www.janelia.org/split-GAL4.
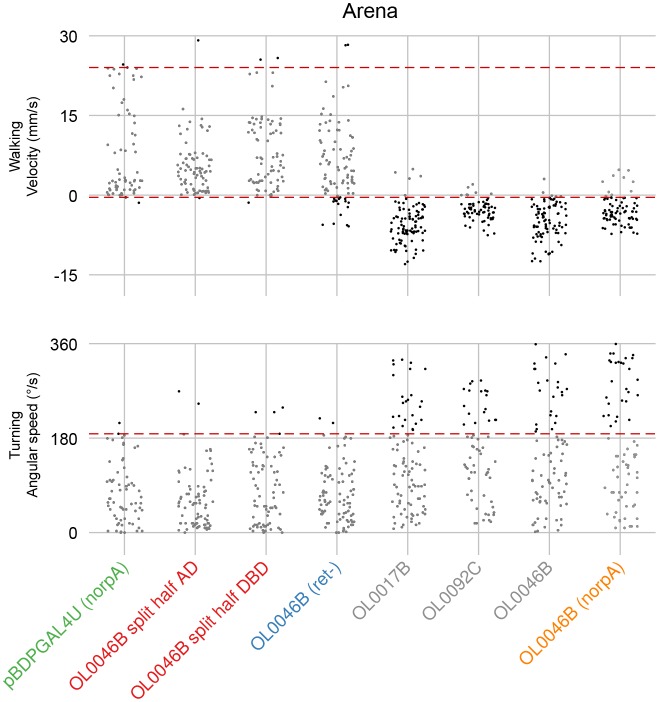
Figure 9—figure supplement 2. Quantification of LC16 activation induced locomotor behaviors and determination of behavioral penetrance.

Figure 9—figure supplement 2.

Jitter plots show the distribution of mean velocity and angular speed during optogenetic stimulation of multiple LC16 split-GAL4 driver lines and control lines. Color codes are the same as in Figure 9. Penetrance was determined as in Figure 8—figure supplement 1E.