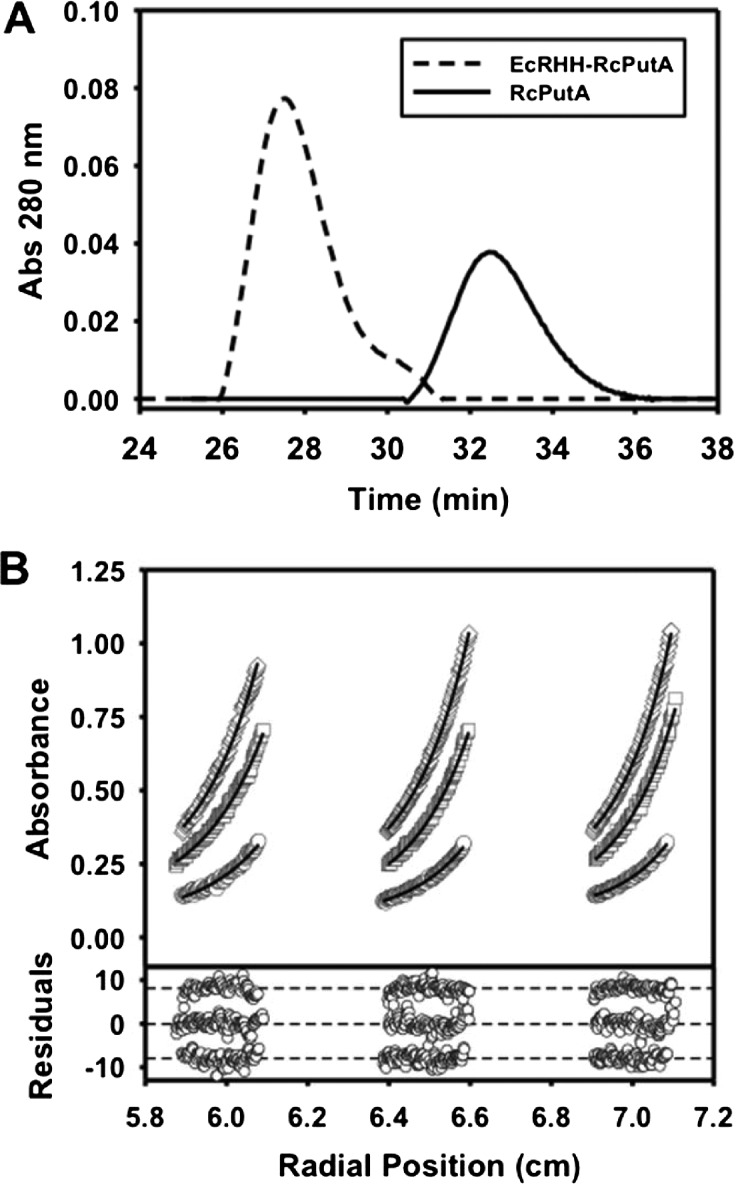
Figure 3. Oligomeric structure analysis of EcRHH–RcPutA.
(A) Gel filtration elution profiles (monitored at 280 nm) of RcPutA (solid trace) and EcRHH–RcPutA (dotted trace). (B) Sedimentation equilibrium analysis of EcRHH–RcPutA. The curves represent global fit analysis of data from 0.2 mg/ml (circles), 0.5 mg/ml (squares) and 0.8 mg/ml (diamonds) EcRHH–RcPutA at 8000 rpm to an ideal single-species model yielding a 256 kDa species (theoretical 251 kDa). A vertical offset was applied to the residuals that are shown for each fit in the bottom panel. M values are reported at a 95% confidence interval.

