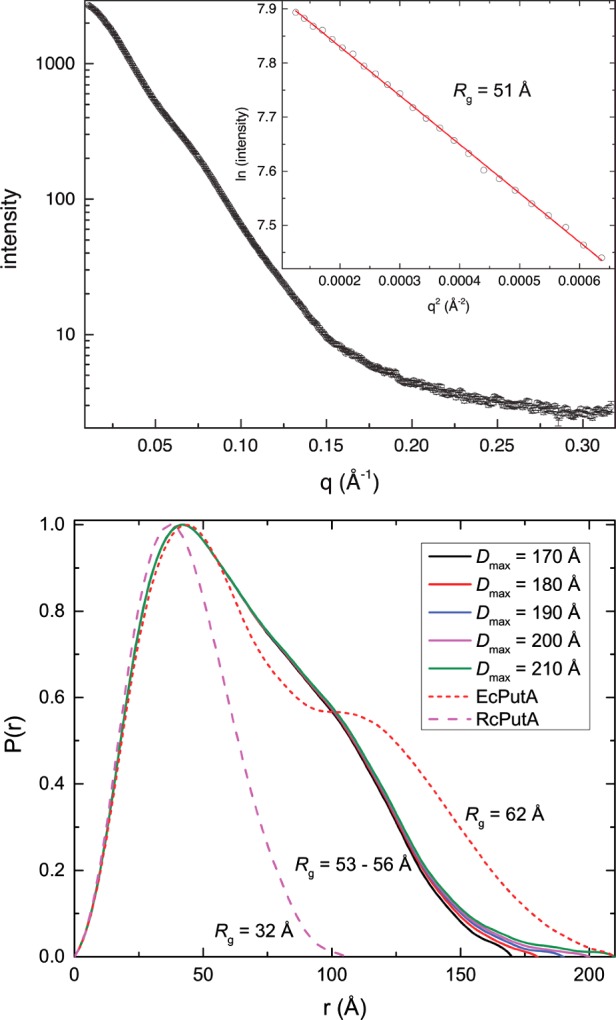
Figure 4. SAXS analysis of EcRHH–RcPutA.

(A) Experimental SAXS curve and Guinier analysis (inset). The Guinier plot spans the range of qRg=0.584–1.31. The linear fit of the Guinier plot has R2 of 0.9992. (B) P(r) curves for EcRHH–RcPutA for assumed Dmax values of 170–210 Å. The P(r) curves for RcPutA [29] and EcPutA [46] are shown for reference.
