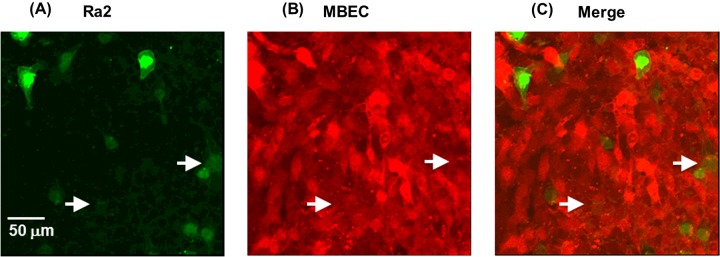
Figure 2. Localization of Ra2 cells in the MBEC monolayer.
Confocal fluorescence microphotographs of Ra2 cells (green) and MBECs (red) 24 h after the addition of Ra2 cells to MBECs cultures. (A–C) Representative orthogonal images at two different z-positions: focus on Ra2 cells (A), focus on MBECs (B), (C) merge of (A) and (B). Arrows indicate Ra2 cells that were identified under MBECs.

