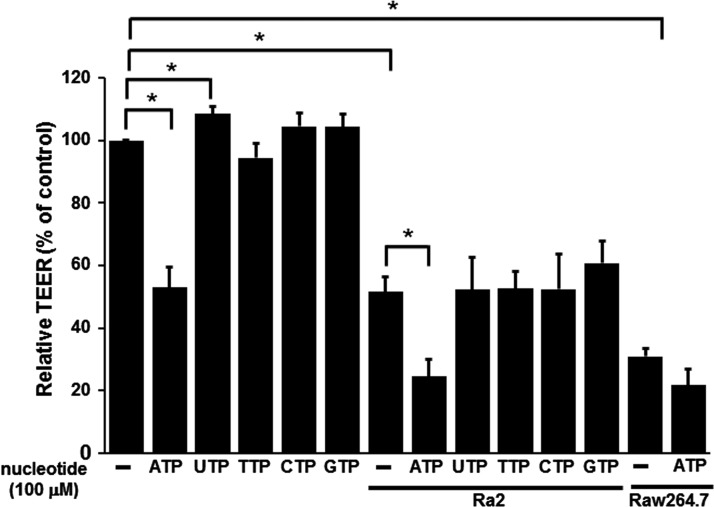
Figure 3. TEER measurements of the MBEC monolayer 48 h after the addition of Ra2 or RAW264.7 cells.
The integrity of the MBEC monolayer before and after the addition of Ra2 cells or RAW264.7 cells in the presence or absence of nucleotides, as indicated by TEER. Data are expressed as the ratio of the experimental TEER value to the baseline TEER value (MBECs only) and presented as the mean±S.E.M. for three experiments; *, P<0.05 (two-tailed Student's t test).

