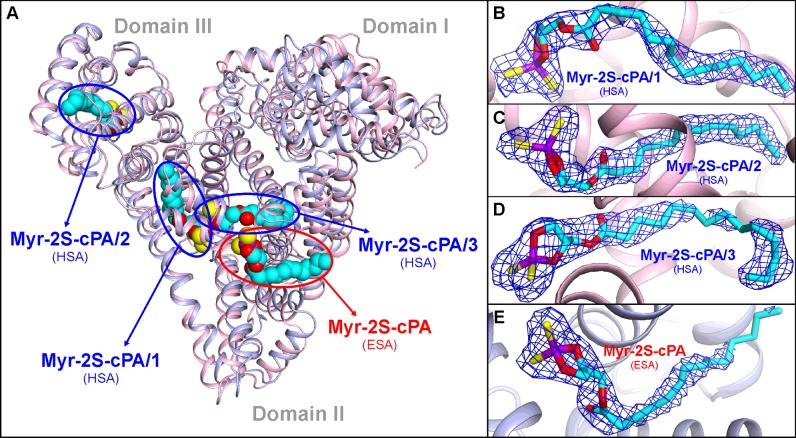
Figure 4. Myr-2S-cPA binding sites identified in HSA and ESA.
(A) Superposition of HSA (light pink) and ESA (light blue) complexes with Myr-2S-cPA. (B) Conformation of the Myr-2S-cPA/1 in site 1 of HSA. (C) Conformation of the Myr-2S-cPA/2 in site 2 of HSA. (D) Conformation of the Myr-2S-cPA/3 in site 3 of HSA. (E) Conformation of the Myr-2S-cPA bound in ESA. 2Fo–Fc electron density maps for the bound ligands are contoured at 1 σ level. Atoms of the Myr-2S-cPA are colored as follows: carbon (cyan), oxygen (red), sulfur (yellow) and phosphorus (violet); the color coding is consistent in all figures.

