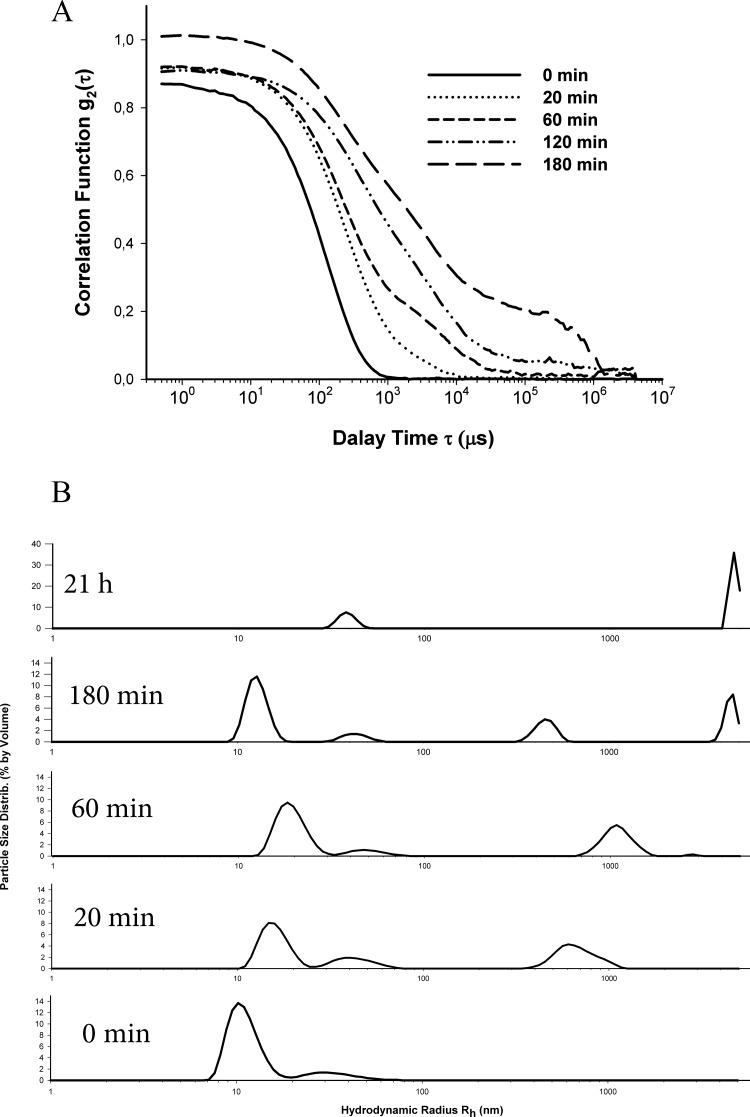
Figure 4. Kinetics of fibril formation by SMT, monitored with DLS.
(A) Evolution of field autocorrelation functions g2(t) of light scattered during SMT amyloid aggregate formation (pH 7.0–7.5, T=10–25°C). (B) Distribution of SMT particles. Generation of large aggregates and their time-dependent growth are shown.

