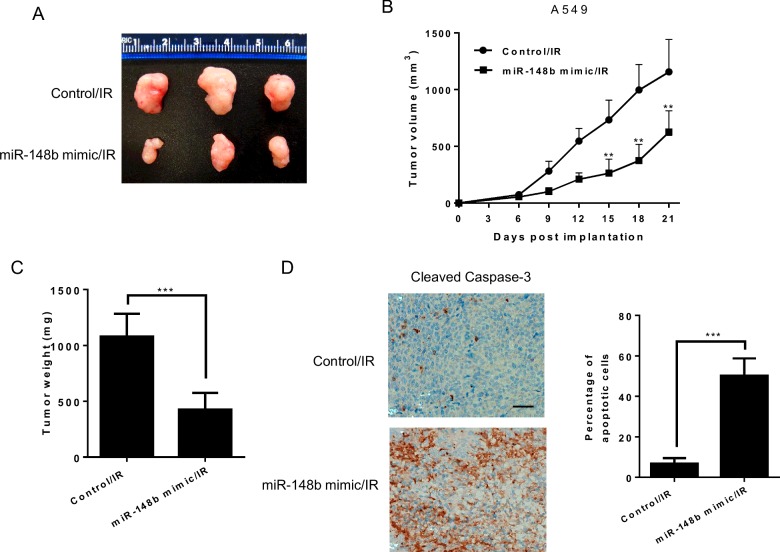
Figure 5. Up-regulation of miR-148b decreases A549 cell radioresistance in vivo.
(A) Image of representative tumours from control or miR-148b mimic transfected A549 xenografts 3 weeks after exposure to 8 Gy of γ-radiation. (B) Tumour growth curve of control or miR-148b mimic injected A549-IR tumours. n=5 for each group. (C) Weights of tumours from mice described above at sacrifice. (D) Representative cleaved caspase 3 IHC staining of xenografts from the two groups in (C). The bar graph presents the quantification of IHC staining. The scale bar indicates 100 μm. Data represent mean ± S.D. **, P<0.01; ***, P<0.001.

