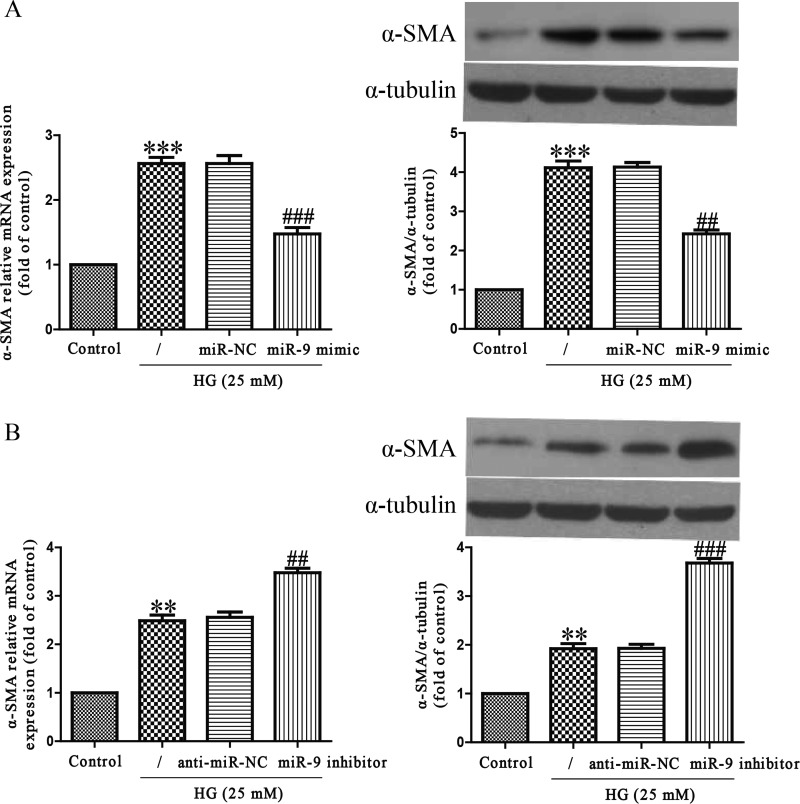
Figure 2. Effects of miR-9 on HG-induced differentiation in HCFs.
HCFs were transfected with miR-9 inhibitor or mimic, and then treated with 5.5 or 25 mM glucose for 24 h. (A and B) The mRNA and protein levels of α-SMA were determined by qRT-PCR and Western blot respectively. The data shown are mean ± S.E.M. (n=4). **P<0.01, ***P<0.001 compared with control; ##P<0.01, ###P<0.001 compared with vehicle + HG.

