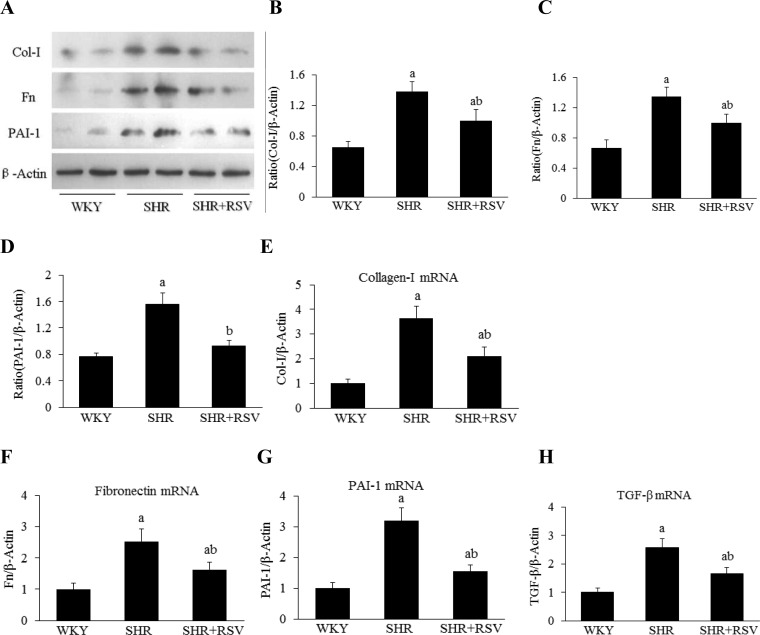
Figure 3. RSV decreases profibrogenic gene expression in SHR.
Effects of RSV on renal fibrotic gene and protein expression levels in SHR (n=6). (A) Col I, Fn and PAI-1 expression by Western blot. (B–D) Quantification of Col I, Fn and PAI-1 expression is achieved using densitometric values normalized to β-actin levels. (E–H) The relative mRNA levels of Col I, Fn, PAI-1 and TGF-β expression by real-time semi-quantitative PCR. The values were normalized to the β-actin values and then expressed as relative quantification, (aP<0.05 compared with WKY; bP<0.05 compared with SHR).

