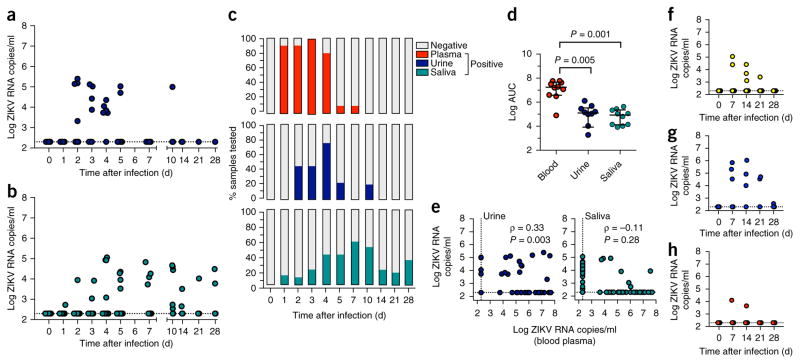
Figure 2.
Timing and magnitude of ZIKV shedding in CSF and mucosal fluids during primary infection. (a,b) ZIKV RNA was extracted from each specimen and quantitated by RT–qPCR in urine (a) or saliva (b). (c) The percentage of ZIKV RNA positive blood plasma, urine and saliva samples are shown over time after infection. (d) The total ZIKV RNA burden found in blood, urine and saliva, as expressed as AUC. (e) The association between ZIKV RNA levels in blood plasma and each of urine or saliva is shown. The strength and direction of any association was assessed. Spearman correlation coefficient (ρ) and P value are indicated. (f–h) Longitudinal (weekly) ZIKV RNA measurements in CSF (f), semen (g) and vaginal fluids (h) are shown. Error bars indicate interquartile range with median. The comparison of the values from the groups of animals was determined using a nonparametric Kruskal–Wallis test with multiple-comparison test.

