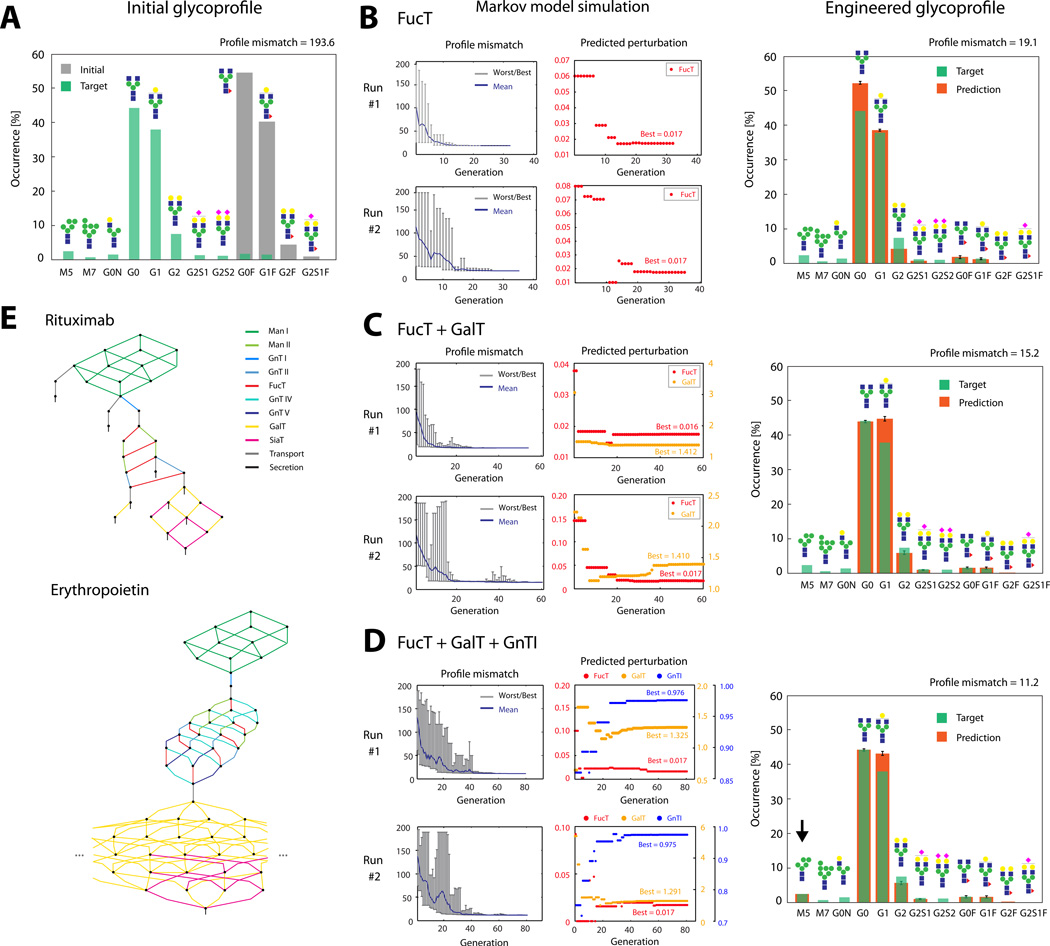
Figure 1.
(A): Glycoprofiles on Rituximab, expressed in CHO-S cell line before any glycoengineering (“Initial”). The target profile shows the glycoprofile of the innovator drug as reported previously (Visser et al., 2013). (B)–(D): Results from the Markov-model based glycoengineering simulation (two representative runs shown) considering only FucT (B), FucT+GalT (C) or FucT+GalT+GnTI (D) reaction sets for perturbation. Profile mismatch evolution plots (left) show the worst, best and mean profile mismatches in each generation of the genetic algorithm. Perturbation plots (right) show the quantity of predicted perturbation yielding the best match in each generation. Glycoprofiles (far right) are calculated with the averages of perturbations throughout all independent simulation runs. Error bars are standard deviation. (E): Reaction network for the glycoprofiles on Rituximab and partial reaction network reconstructed for the glycoprofile on erythropoietin. Reactions are color-coded according to the glycosylation enzyme involved.

