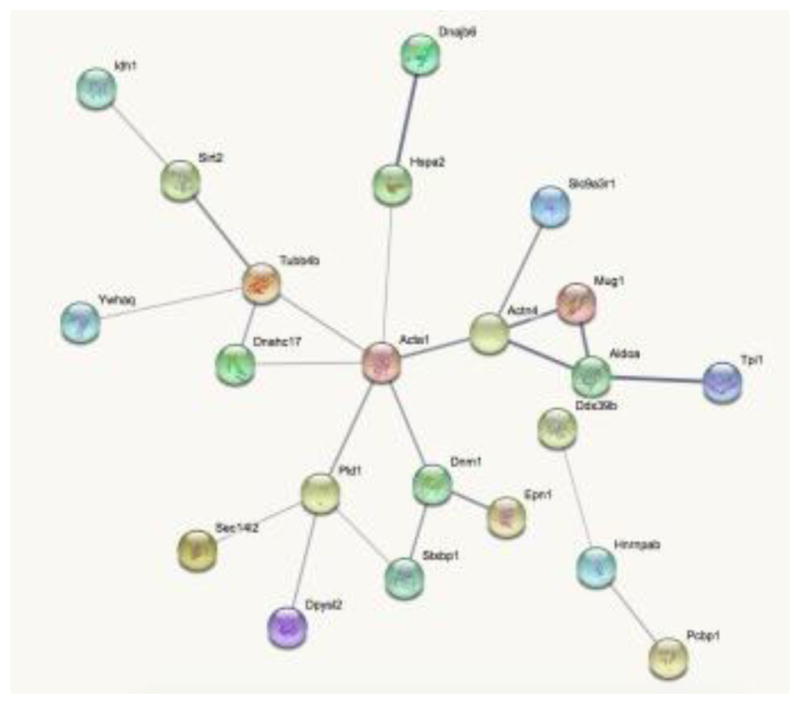
Figure 4. Interaction network of dysregulated proteins by STRING.

Line thickness indicates the strength of data support for protein-protein interactions. Disconnected proteins are hided from the network. Small nodes indicate unknown 3D structure, while large nodes have known or predicted 3D structure within nodes. Associations are meant to be specific and meaningful, i.e. proteins jointly contribute to a shared function; this does not necessarily mean they are physically binding each other.
