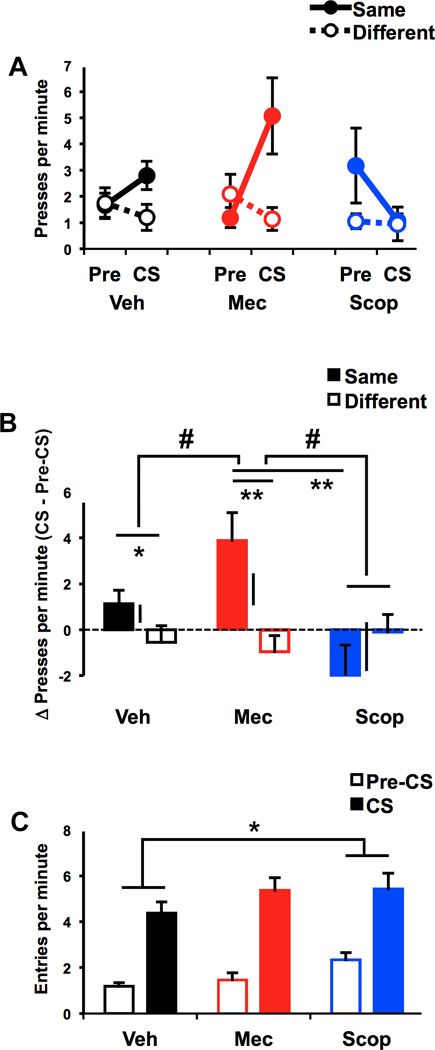
Figure 3.

Results of outcome-specific Pavlovian-to-instrumental transfer (PIT) testing. A, Mean rate of lever pressing during pre-CS and CS periods, plotted separately for each action based on its relationship to the CS (Same vs. Difference). B, Difference scores showing CS-induced changes in performance of each Action (CS – Pre-CS). C. Mean rate of food cup entry during pre-CS and CS periods. For all graphs, data are plotted separately for vehicle (black), mecamylamine (red) and scopolamine (blue) tests. Error bars show SEMs (capped bars A–C). Floating lines in B show the standard error of the difference between Δ Same andΔ Different, which reflects the outcome-specific influence of the CS on lever pressing (see text). * indicates p < 0.05, ** p < 0.01 for pairwise comparisons. # indicates significant partial interaction between subset of drug conditions and Action.
