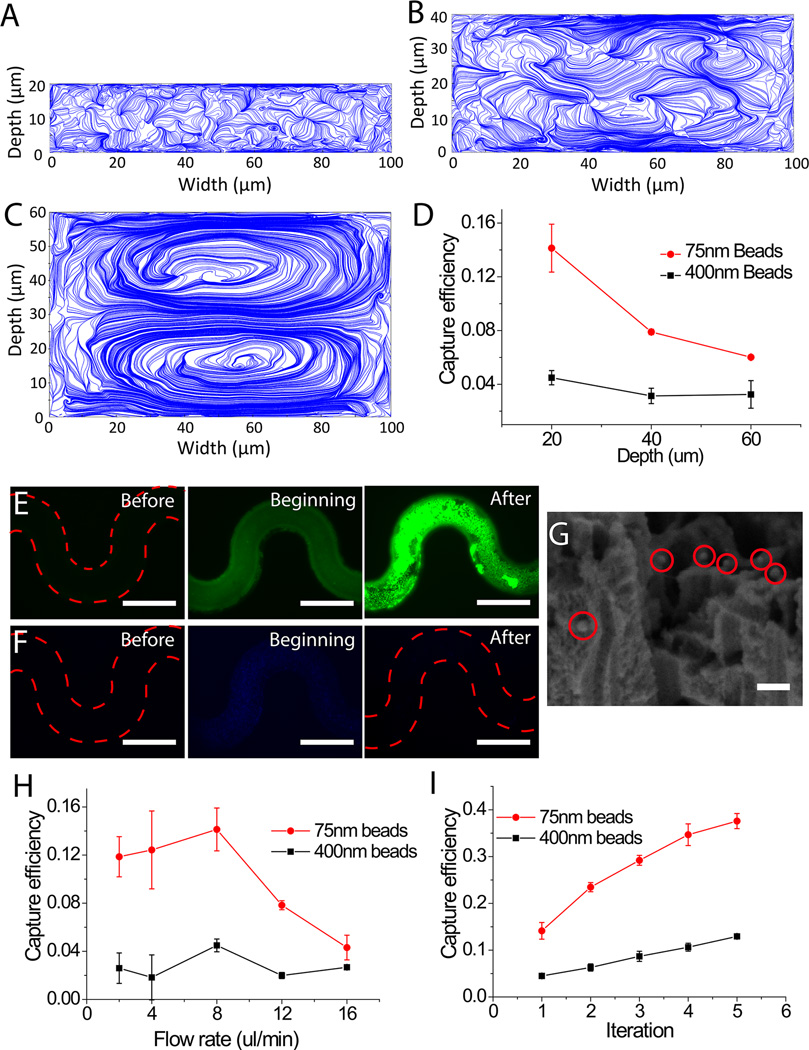
Figure 3.
Capture of nanoscale particles inside the pSiNWs microfluidic devices with the effect of the Dean flow. (A)–(C) FEM simulations showing velocity field on the cross-sectional planes of meandering flow channels with channel depths of 20, 40 and 60 µm, respectively. 0 and 100 µm point the outer and inner rim of channel, respectively. (D) Capture efficiency of 75 nm and 400 nm nanobeads in channels with 20, 40 and 60 µm height, respectively. (E) Capture of 75 nm green nanobeads showing top views of the pSiNWs flow channels before, at the beginning, and after the introduction of the nanobeads (bar: 200 µm); (F) Capture of 400 nm blue nanobeads showing top views of the pSiNWs flow channels before, at the beginning and after the introduction of the nanobeads (bar: 200 µm); (G) SEM image of captured 75 nm nanobeads (bar: 150 nm). (H) Capture efficiency of 75 nm and 400 nm nanobeads under different flow rates. (I) Capture efficiency of 75 nm and 400 nm nanobeads versus number of run times of the same sample in the same device.

