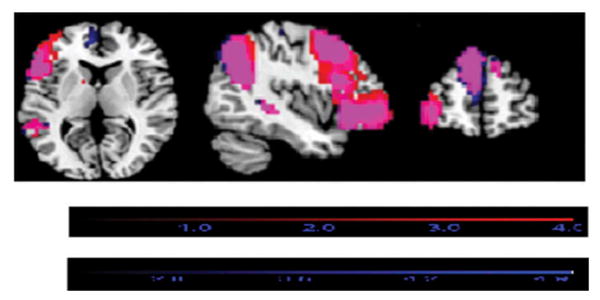
Figure 2.

Overlay of the left frontoparietal resting-state networks associated with SNI1 (red) and SNI2 (blue) on the same template. The purple color represents the areas in which the networks overlap. The red color shows where the SNI1 networks extend beyond the SNI2 networks. The blue color shows where the SNI2 networks extend beyond the SNI1 networks.
