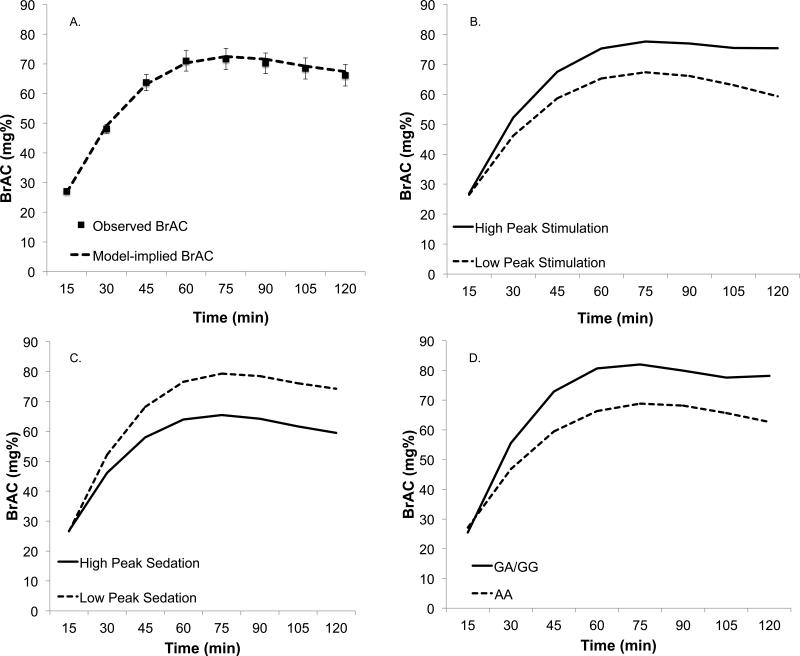
Figure 1.
Results of the multilevel models (MLM) of change in BrAC over the self-administration session (Session 2). Panel A shows the unconditional effects of time derived from the MLM (i.e., the model-implied BrAC) with observed mean BrAC readings superimposed (standard errors in error bars). Panel B shows the simple slopes for the effects of time at high (M+1SD) and low (M−1SD) levels of peak stimulation during session 1. Panel C shows the simple slopes for the effects of time at high (M+1SD) and low (M−1SD) levels of peak sedation during session 1. Panel D shows the simple slopes for the effects of time conditioned on each of the genotype groups. Race is included as a covariate in the genotype model (Panel D).

