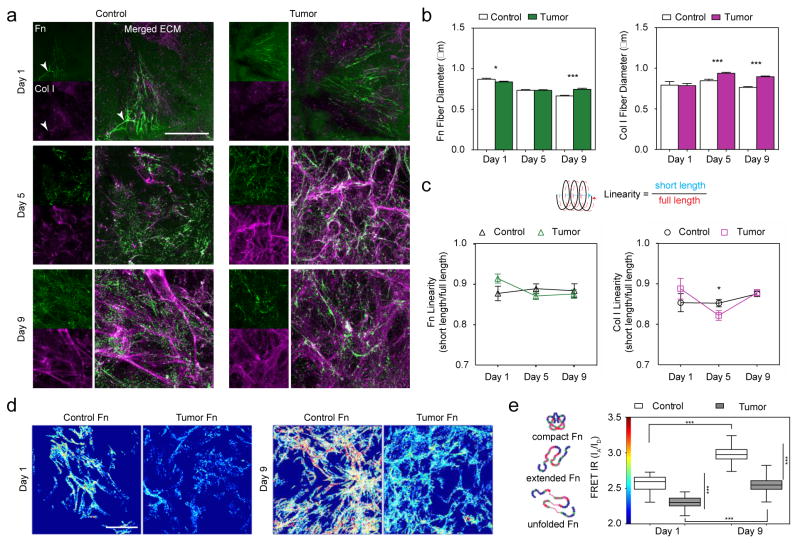
Figure 1. Structural and conformational alterations in the developing tumor-associated (TC) Fn-Col I matrix.
a) Immunofluorescence depicting the evolution of control (c)- and tumor-associated (TC)- ECMs over 9 days: fibronectin (green) and collagen I (magenta). Overlay of ECM with F-actin and DAPI is shown in SI Fig 1. While Fn is present at all times, fibrillar Col I is only fully assembled at later time points.
b) TC- fibers (both Fn and Col I) become gradually thicker than their control (c-) counterparts. Fn Day 1: 0.84 ± 0.01 μm, n = 723 vs. 0.87 ± 0.01 μm, n = 640; p < 0.05. Col I Day 1: 0.79 ± 0.03 μm, n = 66 vs. 0.79 ± 0.04 μm, n = 54. Fn Day 5: 0.73 ± 0.01 μm, n = 1862 vs. 0.73 ± 0.01 μm, n = 1226. Col I Day 5: 0.94 ± 0.01 μm, n = 432 vs. 0.84 ± 0.02 μm, n = 338; p < 0.0001. Fn Day 9: 0.75 ± 0.01 μm, n = 1337 vs. 0.66 ± 0.01 μm, n = 1012. Col I Day 9: 0.9 ± 0.01 μm, n = 1297 vs. 0.76 ± 0.01 μm, n = 647; p < 0.0001. Mean ± SEM.
c) Although TC- fibers (both Fn and Col I) are initially more strained (higher linearity) than c- fibers, all data converge towards a similar steady-state strain value in the mature ECM. Fn Day 1: 0.91 ± 0.01, n = 90 vs. 0.88 ± 0.02, n = 49. Col I Day 1: 0.89 ± 0.03, n = 34 vs. 0.85 ± 0.02, n = 31. Fn Day 5: 0.87 ± 0.01, n = 130 vs. 0.89 ± 0.01, n = 79; Col I Day 5: 0.82 ± 0.01, n = 169 vs. 0.85 ± 0.01, n = 200; p < 0.05. Fn Day 9: 0.88 ± 0.01, n = 92 vs. 0.88 ± 0.02, n = 38; Col I Day 9: 0.88 ± 0.01, n = 205 vs. 0.88 ± 0.01, n = 220. Mean ± SEM.
d) FRET maps show lower FRET, i.e., more unfolded Fn, in TC-ECM (bluish fibers) than in c-ECM (yellow/red fibers). Scale bar: 50 μm.
e) Mean FRET ratios (IA/ID) highlight the significant conformational differences between TC-Fn and c-Fn and their evolution over time. FRET Day 1: 2.303 ± 0.011, n = 47 vs. 2.566 ± 0.013, n = 54; p < 0.0001. FRET maps also display a global shift towards higher FRET from Day 1 to Day 9, indicating Fn fiber relaxation in presence of Col I. FRET Day 9: 2.552 ± 0.013, n = 60 vs. 2.975 ± 0.012, n = 76; p < 0.0001. Mean ± SEM.

