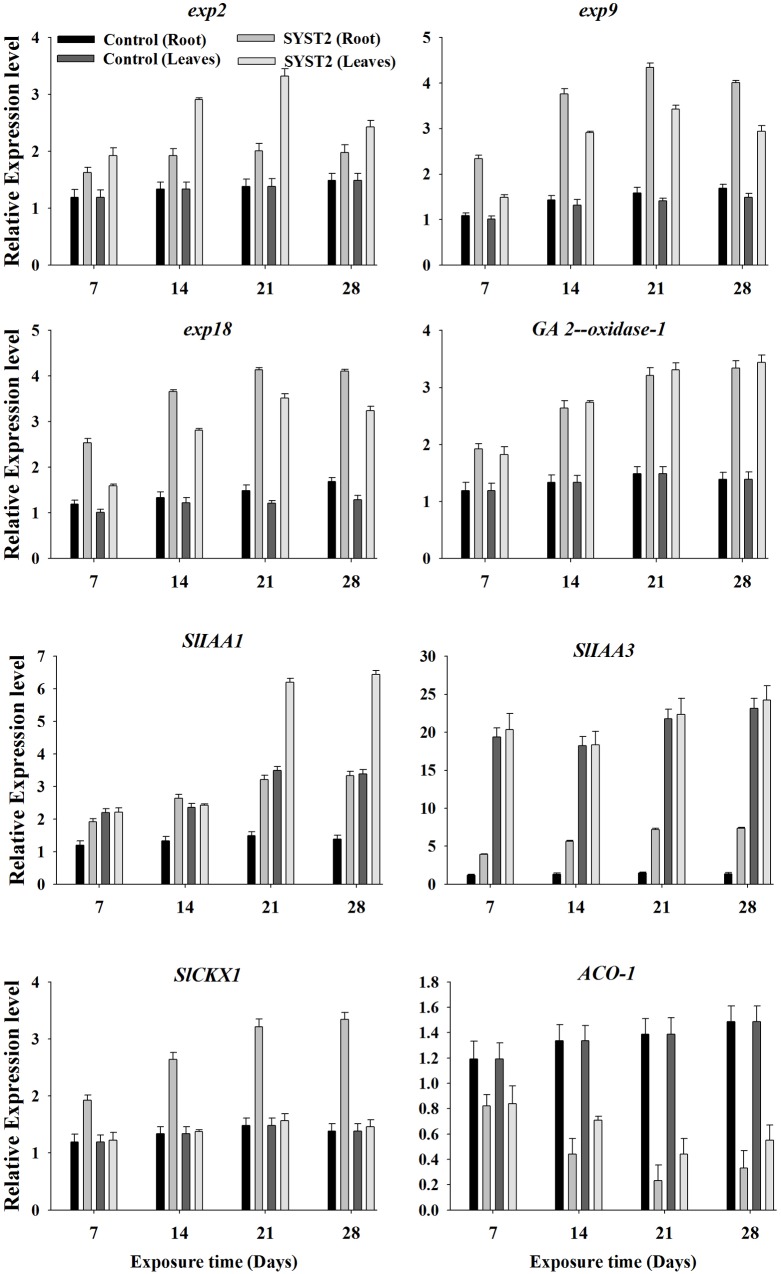
FIGURE 6.
Transcriptional expression profiles of genes involved in expansin, auxin, cytokinin, and gibberellin synthesis and metabolism. qRT-PCR was performed with SYBR Green/Fluorescent qPCR master mix (Takara) on a Roche-480 system (Roche), using EF-1α as an internal reference. The relative expression levels of Exp2. Exp9. Exp18. ACO-1, GA (20ox-1), SlIAA1. SlIAA3, and SlCKX1 were determined. Error bars indicate standard errors of the means. Different lower case letters above the error bars represent significant differences according to Duncan’s multiple-range test (P ≤ 0.05) using SPSS software (SPSS, Chicago, IL, USA).

