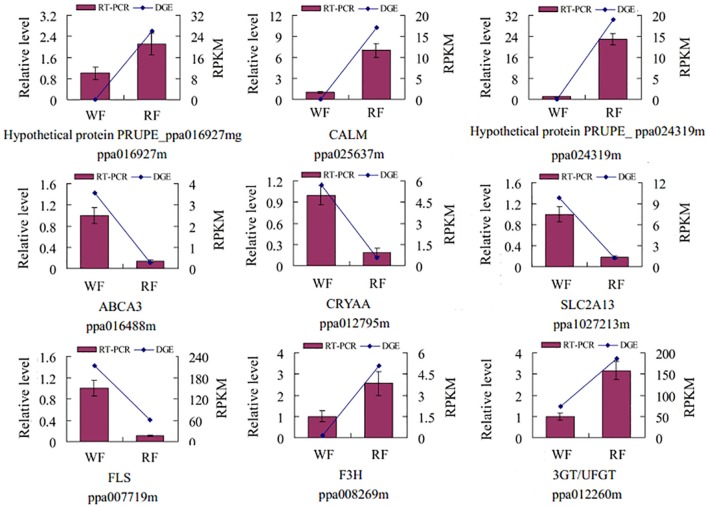
Figure 3.
Validation of the tag-mapped genes with quantitative RT-PCR in Japanese apricot. The x-axis indicates the two libraries. The y-axis shows the gene expression levels: the left side is the relative expression level as determined by quantitative RT-PCR (red shaded bars), whereas the right side is reads per kb per million reads by RNA-seq (blue line). Calmodulin (CALM), MFS transporter, SP family, solute carrier family 2 member 13 (SLC2A13), anthocyanidin/flavonol 3-O-glucosyltransferase (3GT/UFGT), crystallin, alpha A (CRYAA), ATP-binding cassette, subfamily A member 3 (ABCA3), naringenin 3-dioxygenase (F3H), flavonol synthase (FLS).

