
FIGURE 3.
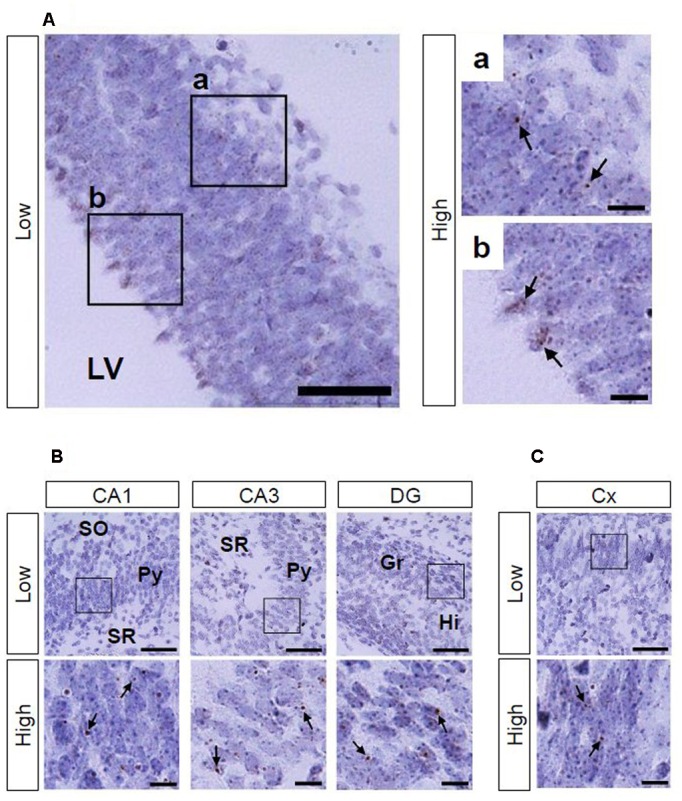
AhR mRNA expression in the telencephalon of mice on ED 12.5 and ED 18.5. Brown punctae (arrows) represent AhR transcript in the cerebral cortex (A) on ED 12.5, and in the hippocampus (B) and cerebral cortex (C) on ED 18.5. “Low” and “High” indicate magnification. High magnification images represent the areas enclosed by boxes in the low-magnification images. Scale bars = 50 and 10 μm in low and high magnification images, respectively. Gr, granule cell layer; Hi, hilus; LV, lateral ventricle; Py, pyramidal cell layer; SO, stratum oriens; SR, stratum radiatum.