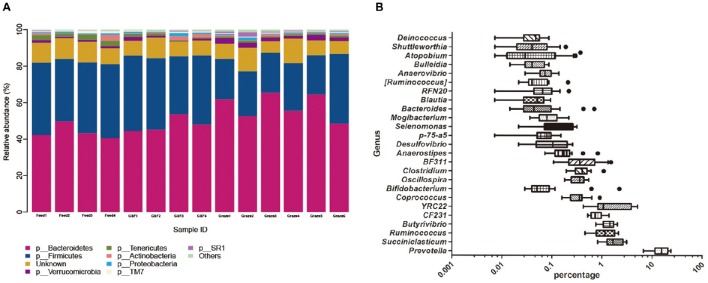
Figure 1.
Dominant bacterial phylum in individual samples and the shared bacterial genera across ruminal samples. (A) The bacterial taxonomic composition of individual yak ruminal samples at the phylum level. (B) The relative abundance of shared bacterial genera across yak ruminal samples in shown via a box plot of the relative abundance of bacterial genera shared by all samples. Percentage is shown on the X-axis. The boxes represent the interquartile range (IQR) between the first and third quartiles (i.e., 25th and 75th%, respectively), and the vertical line inside the box defines the median. Whiskers represent the lowest and highest values within 1.5 times the IQR from the first and third quartiles. Samples with a relative abundance for a given genus exceeding those values are represented as points beside the boxes. The groups are: indoor feeding regime (feed), pasture grazing regime (graze), and grazing, and supplementary feeding regime (GSF).

