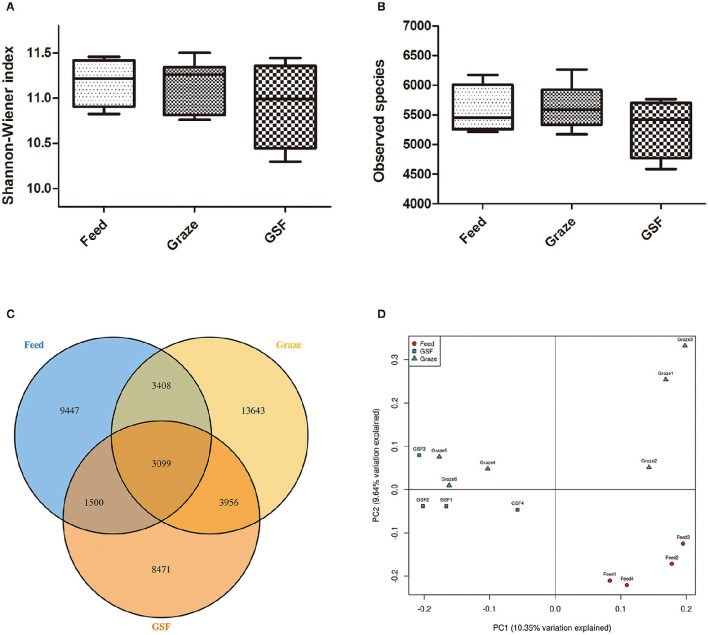
Figure 3.
Differences in bacterial community diversity, richness, and OTUs between feeding regimes. (A) Shannon-Weiner diversity in yak ruminal samples. (B) Observed species in yak ruminal samples. (C) A venn diagram showing the different and similar OTUs between feeding regimes. (D) A principal coordinate analysis (PCoA) of the yak ruminal microbiota from the three feeding groups. The PCoA plots were constructed using the unweighted UniFrac method. The groups are: indoor feeding regime (feed), pasture grazing regime (graze), and grazing and supplementary feeding regime (GSF).

