
Figure 2.
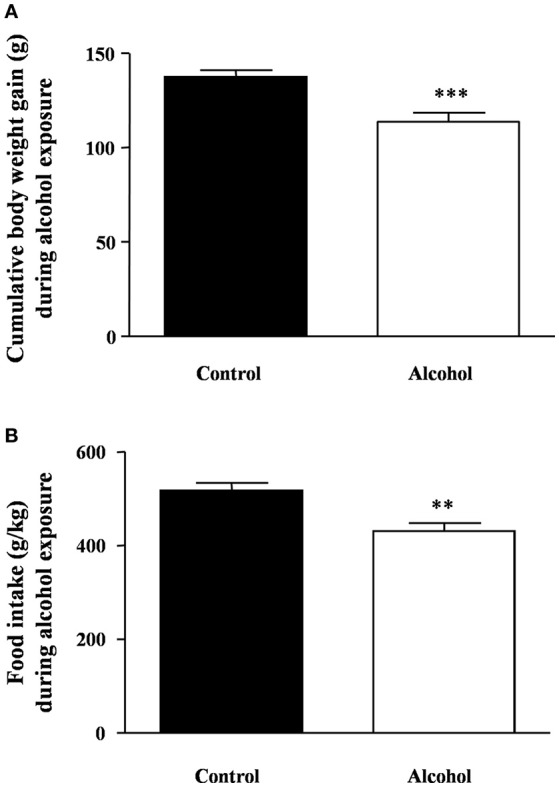
Body weight gain and food intake during intermittent alcohol exposure in adolescent rats. Cumulative body weight gain (A) and food intake (B) after 4 weeks of alcohol exposure. Bars represent the mean ± SEM (8–12 animals per group). Data were analyzed by Student's t-test (Welch's correction). **p < 0.01 and ***p < 0.001 denote significant differences compared with the control group.