
Figure 1.
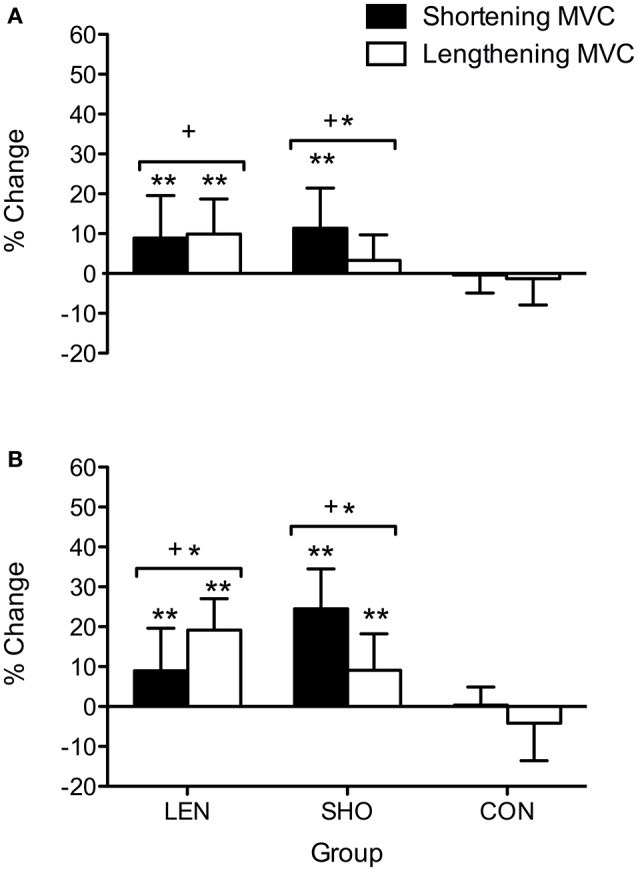
Percentage change in shortening and lengthening MVC across time. (A) Percentage change pre to mid. (B) Percentage change pre to post. *Denotes significant difference between muscle contractions; +significantly different to control group; **Significantly different from pre-values.