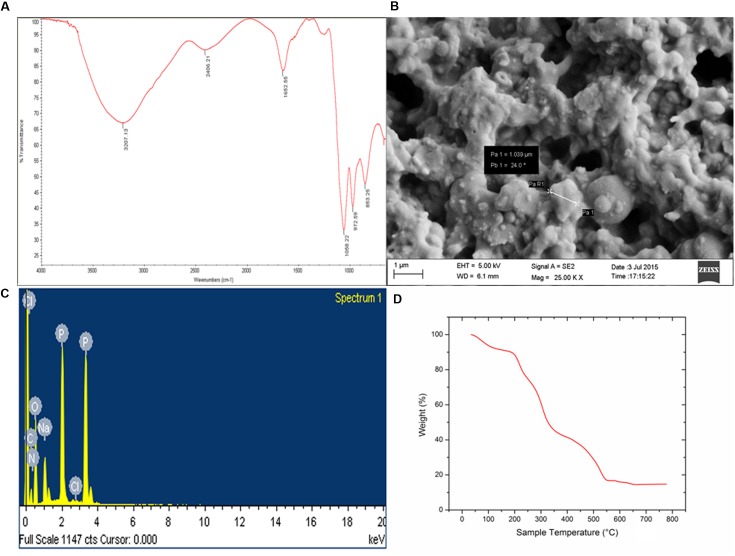
FIGURE 4.
(A) FTIR-ATR spectra of purified bioflocculant showing presence of hydroxyl, amino, and carboxylic group. (B) Irregular shape of the extracellular bacterial bioflocculant. (C) SEM-EDX spectra depicting presence of C, N, O, Na, P, and Cl in the purified bioflocculant content. (D) TGA showed stability of carbohydrate and protein portion in bioflocculant.

