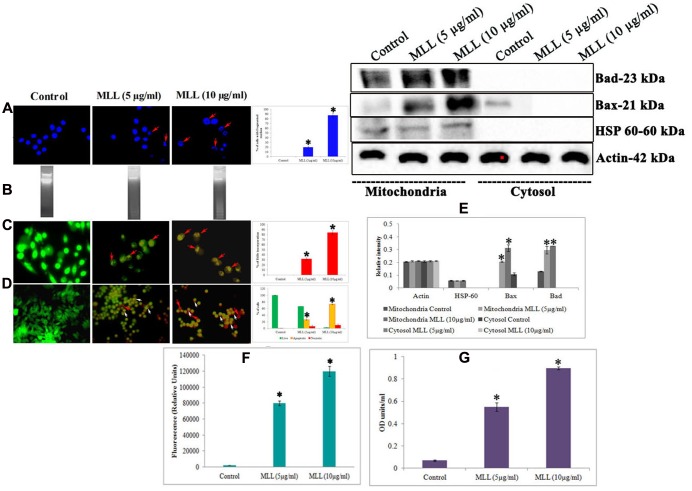
FIGURE 2.
(A) DAPI staining showing the nuclear fragmentation. Control cells possess well defined nuclear morphology whereas the detached cells under MLL treated conditions showed significant DNA fragmentation (indicated by red arrows). Magnification -40×. Bar diagram showing the percentage of fragmented DNA. Values are average of three independent experiments ± SD and ∗p < 0.05 when compared to control. (B) Agarose gel electrophoresis showing the nuclear fragmentation of control and MLL treated detached cells. (C) Acridine orange/Ethidium bromide staining indicating the disruption in the membrane integrity in the detached cells (indicated by red arrows). Control cells exhibited green fluorescence because of the intact cell membrane. Magnification -40×. Bar diagram showing the percentage of EtBr fluorescence. Values are average of three independent experiments ± SD and ∗p < 0.05 when compared to control. (D) Annexin V staining showing the live (green fluorescent cells), necrotic (red fluorescent cells indicated by red arrows) and apoptotic cells (orange fluorescent cells indicated by white arrows) in control as well as MLL treated detached cells. Magnification -40×. Bar diagram showing the quantitative measurement. Values are average of three independent experiments ± SD and ∗p < 0.05 when compared to control. (E) Western blot analysis indicating the upregulation of Bax and Bad in the mitochondrial fractions in MLL treated detached cells. HSP-60 was used as the mitochondrial marker protein and actin served as the internal control. (F) Effect of MLL on the activity of caspase 9 of control and MLL treated detached cells. Values are average of three independent experiments ± SD and ∗p < 0.05 when compared to control. (G) Effect of MLL on the activity of Bax in the mitochondrial fraction of control and MLL treated detached cells. Values are average of three independent experiments ± SD and ∗p < 0.05 when compared to control.

