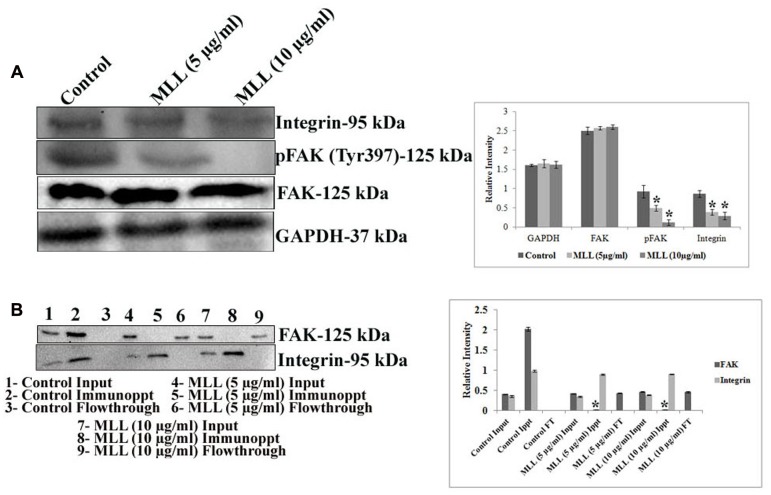
FIGURE 4.
(A) Western blot analysis showing the decreased level of expression of integrin and pFAK under MLL treated conditions compared to control. FAK level remained unaltered. GAPDH was used as the internal control. A quantitative level of expression of different proteins is given in the bar diagram. Values are average of three independent experiments ± SD and ∗p < 0.05 when compared to control. (B) Western blot analysis using FAK and integrin antibody after co-immunoprecipitation of FAK and integrin from the control and MLL treated cell lysates using anti integrin antibody. The intense band in IP when blotted with FAK in the control indicated the interaction between FAK and integrin. On treatment with MLL, integrin-FAK interaction lost and no bands were detected in the IP region (detected in the flow through). The equally intense bands in the IP regions of control and treated cells when blotted with integrin antibody indicated that the integrin levels in the cell lysates taken for IP were same. A quantitative level of expression of different proteins is given in the bar diagram. Values are average of three independent experiments ± SD and ∗p < 0.05 when compared to FAK of control immunoprecipitate.

