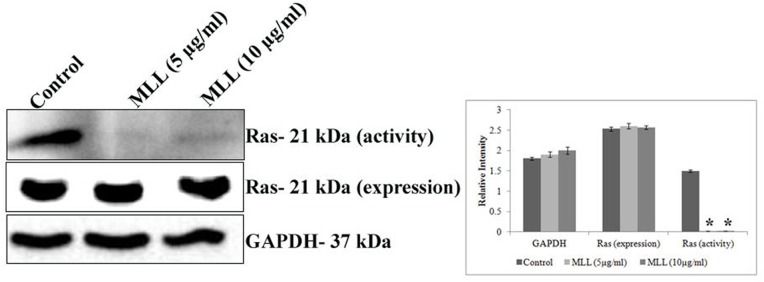
FIGURE 5.
Western blot analysis showing the activity and protein expression levels of Ras in control and MLL treated cells. There was significant downregulation of activity of Ras but the protein expression remains the same. GAPDH was used as the internal control. Bar diagram showing the quantitative measurement. Values are average of three independent experiments ± SD and ∗p < 0.05 when compared to the Ras activity of control.

