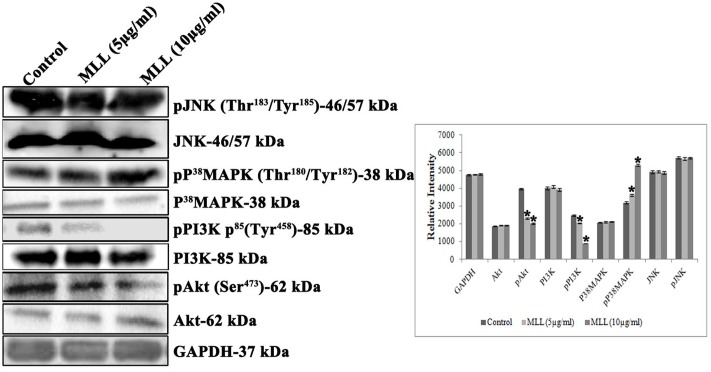
FIGURE 6.
Western blot analysis showing the levels of Akt, pAkt, PI3K, pPI3K, P38MAPK, pP38MAPK, JNK, and pJNK under control and MLL treated conditions. Downregulation in the expression of pPI3K, pAkt and upregulation of pp38 MAPK was noticed on treatment with MLL compared to control. A quantitative level of expression of different proteins is given in the bar diagram. Values are average of three independent experiments ± SD and ∗p < 0.05 when compared to control.

