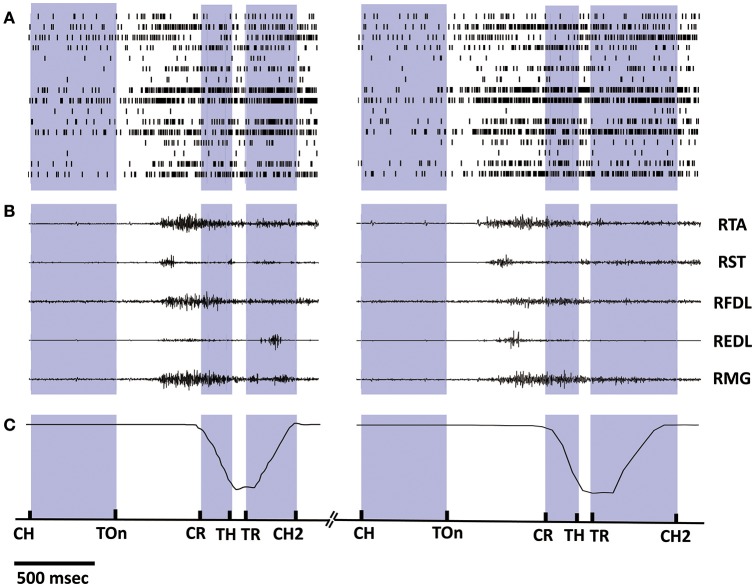
Figure 2.
Synchronized multiple data recorded during 2 successive trials from monkey 1. (A) Spike trains of 16 cortical neurons. Short bars indicates the actual spiking time and each row corresponds to a neuron. (B) EMG signals of 5 lower limb muscles. (C) Position trajectories of the marker on the right ankle of the monkey. The exact time instances of important behavior events are indicated on the bottom time line by short bars: Center Hit (CH), Target On (TOn), Center Release (CR), Target Hit (TH), Target Release (TR), Center Hit Again (CH2), and the exact meaning of these events can be found in Section 2.2. Data within the inter-trial interval (2–5 s) are omitted for displaying.

