
FIGURE 4.
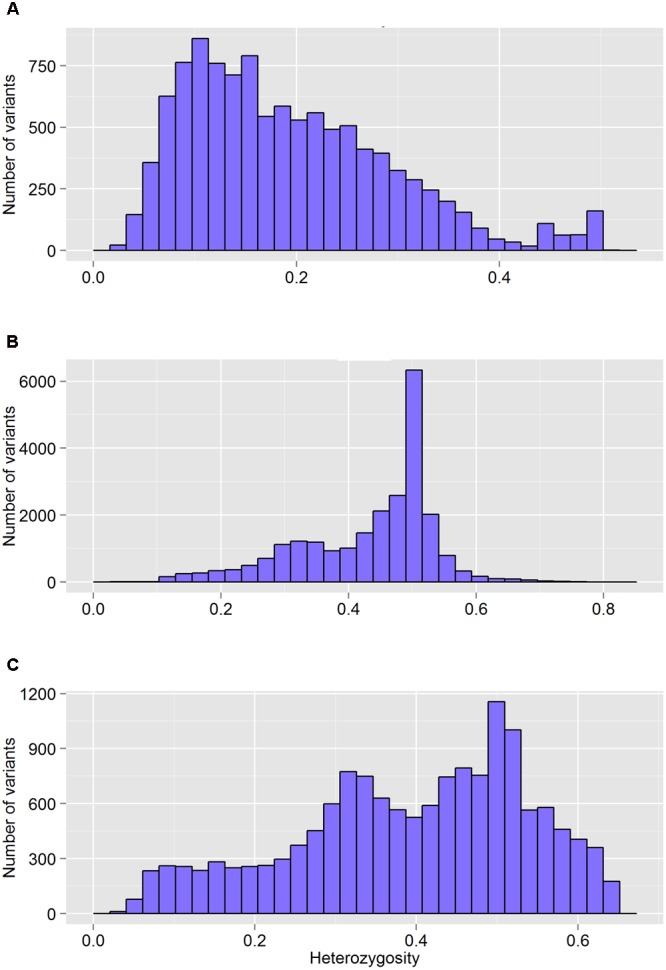
The distribution of heterozygosity of valid variants after genotyping by different GBS pipelines: FreeBayes (A), TASSEL (B), and UNEAK (C).
Official websites use .gov
A
.gov website belongs to an official
government organization in the United States.
Secure .gov websites use HTTPS
A lock (
) or https:// means you've safely
connected to the .gov website. Share sensitive
information only on official, secure websites.
The distribution of heterozygosity of valid variants after genotyping by different GBS pipelines: FreeBayes (A), TASSEL (B), and UNEAK (C).