Figure 1.
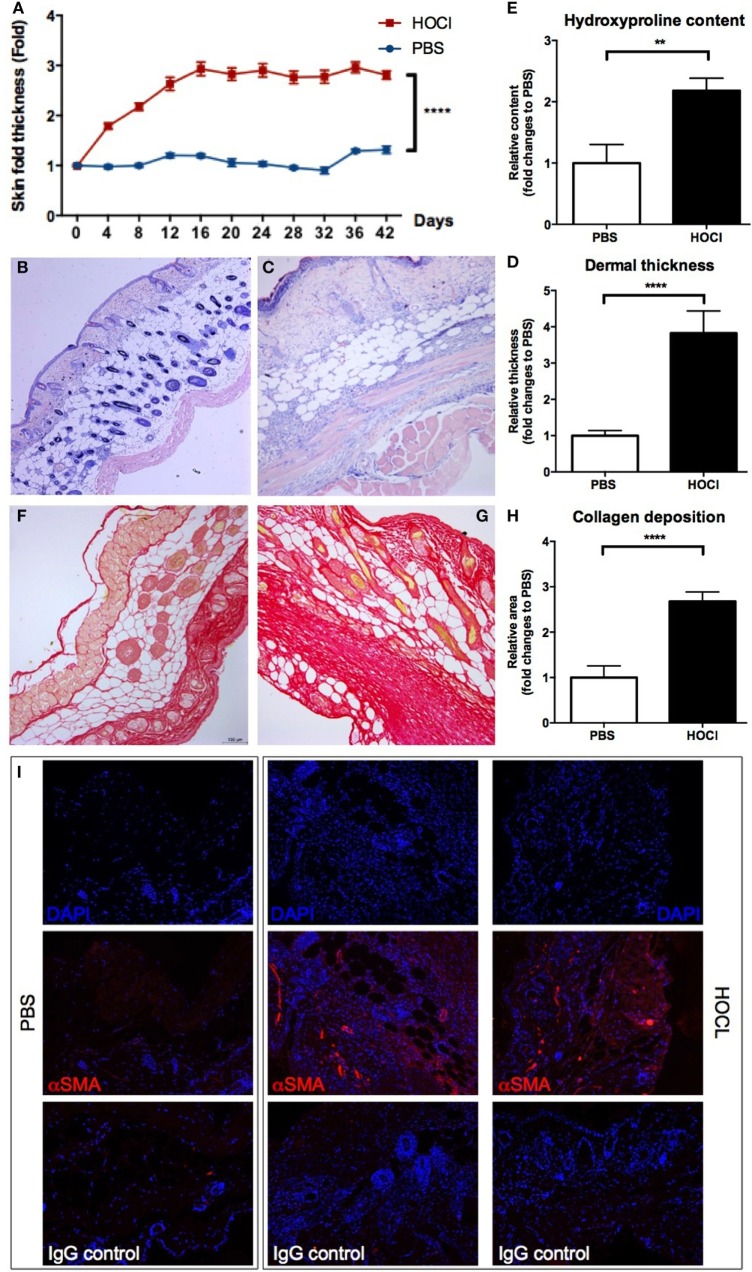
Evaluation of skin fibrosis in phosphate-buffered saline (PBS) and HOCl mice. To confirm the proper induction of the experimental disease, skin fibrosis was assessed by different methods in PBS and HOCl mice at day 42 after the beginning of the protocol. (A) Skin fold thickness (mm) measured sequentially by caliper (n = 20–26 per group). (B,C) Representative images of skin sections stained with May-Grünwald–Giemsa coloration from PBS [(B); 10×] and HOCl [(C); 10×] mice, showing dermal thickening in the HOCl mouse. (D) Dermal thickness measured on skin sections (n = 10–12 per group). Results are expressed as fold changes compared to the PBS group. (E) Hydroxyproline content in 6-mm skin punch biopsies (n = 7–8 per group). Results are expressed as fold changes compared to the PBS group. (F,G) Representative images of skin sections stained with picrosirius-red coloration from PBS [(F); 10×] and HOCl [(G); 10×] mice, showing collagen deposition in the HOCl mouse. (H) Collagen deposition total surface measured on skin sections (n = 10–12 per group). Results are expressed as fold changes compared to the PBS group. (I) Representative images of skin sections immunostained with DAPI alone (top row), DAPI and anti-α-smooth muscle actin (α-SMA) antibody (middle row), or DAPI and isotype control (bottom row) from PBS (left column) and HOCl (center and right columns) mice, showing expression of α-SMA in the HOCl mouse.

