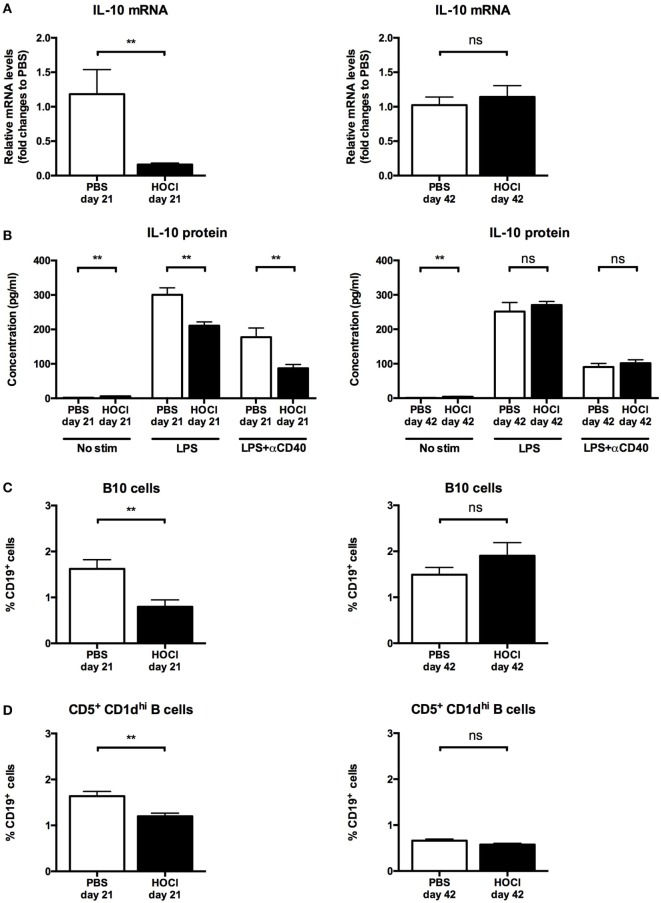
Figure 11.
Interleukin (IL)-10 production and regulatory B cell levels in phosphate-buffered saline (PBS) and HOCl mice at day 21 and day 42. (A) IL-10 mRNA levels in splenic B cells after collection and sorting, normalized to GUSB and expressed as fold changes to PBS day 21 for day-21 groups (left column), and to PBS day 42 for day-42 groups (right column) (n = 4–6 per group). (B) IL-10 supernatant levels after culture of splenic B cells for 48 h with various stimulation conditions [none, lipopolysaccharide (LPS), LPS + anti-CD40 antibody] at day 21 (left column) and day 42 (right column), expressed in picograms per milliliter (n = 6–8 per group). (C) Proportion of B10 cells identified by intracellular IL-10 detection at day 21 (left column) and day 42 (right column), expressed as percentages of CD19+ cells (n = 10 per group). (D) Proportion of CD5+ CD1dhi B cells identified by conventional membrane staining at day 21 (left column) and day 42 (right column), expressed as percentages of CD19+ cells (n = 7–8 per group).

