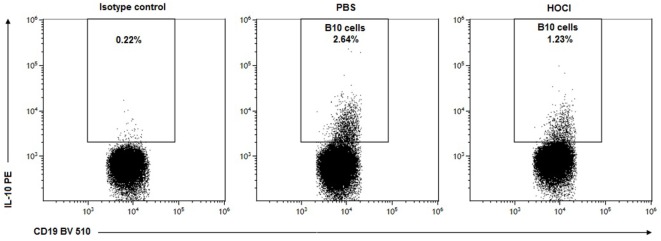
Figure 12.
Representative dot-plots of B10 cells in phosphate-buffered saline (PBS) and HOCl mice at day 21. Representative CD19/interleukin (IL)-10 dot-plots gated on B cells from PBS (middle column) and HOCl (left column) mice at day 21, showing a decreased proportion of B10 cells in the HOCl mouse.

