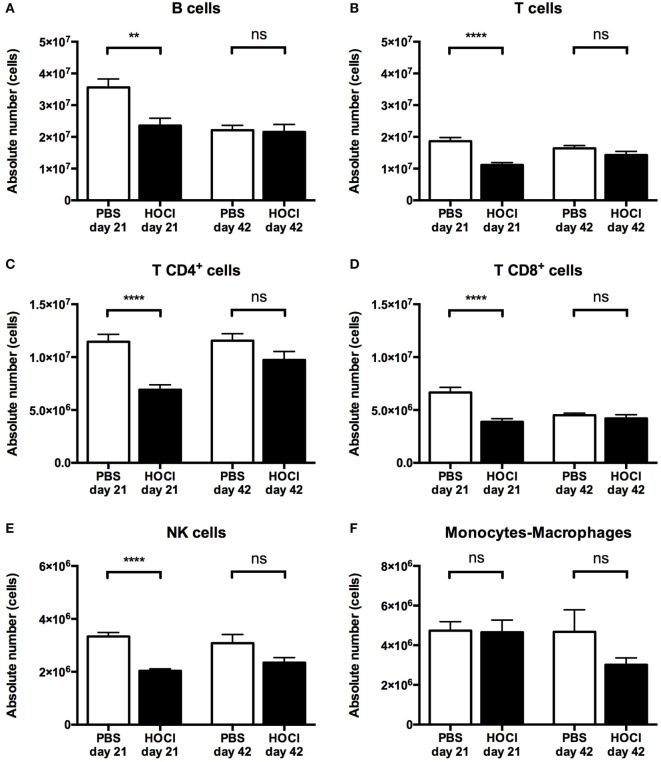
Figure 4.
Distribution of the main spleen cell subsets in phosphate-buffered saline (PBS) and HOCl mice at day 21 and day 42. Distribution of B cells (A), T cells (B), T CD4+ cells (C), T CD8+ cells (D), NK cells (E), and monocytes–macrophages (F) in absolute values expressed in cells (n = 12–17 per group).

