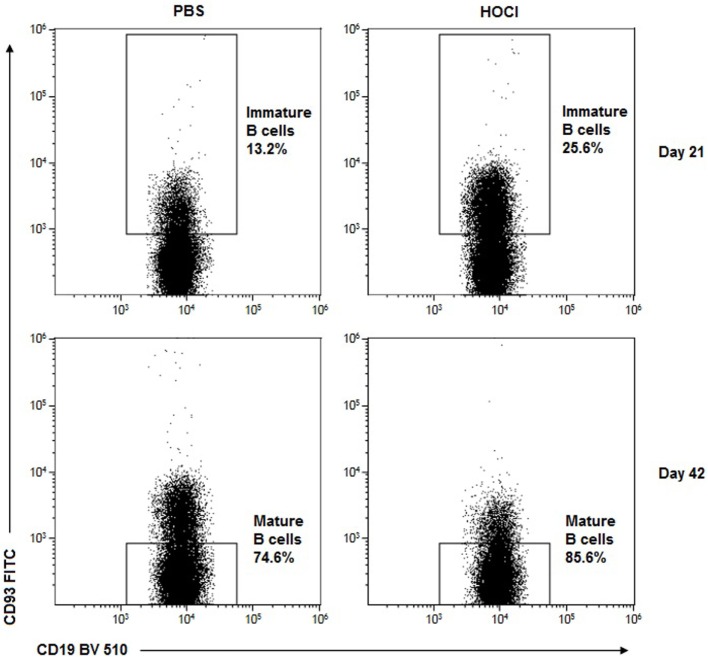
Figure 6.
Representative dot-plots of immature and mature B2 cells in phosphate-buffered saline (PBS) and HOCl mice at day 21 and day 42. Representative CD19/CD93 dot-plots gated on B cells from PBS (left column) and HOCl (right column) mice at day 21 (top row) and day 42 (bottom row), showing early expansion of the transitional subset and late expansion of the mature naïve cells in the HOCl mouse.

