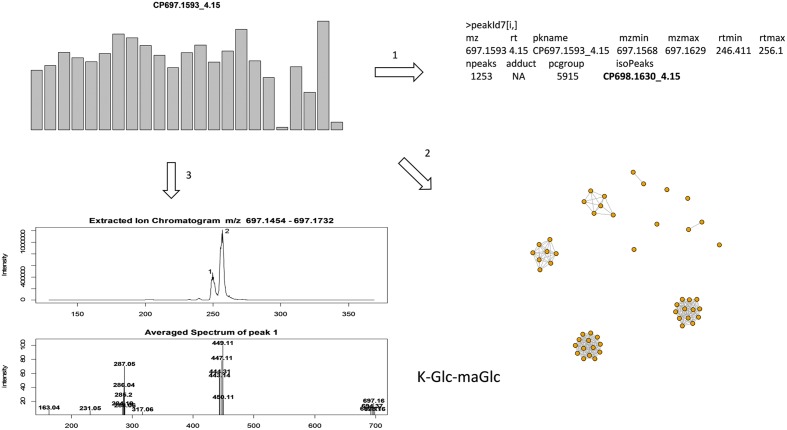
FIGURE 2.
Illustration of annotation methods. To annotate a targeted peak CP697.1593_4.15, it’s isotopic peak (CP698.1630_4.15) must be present in the peak annotation table, and the peak retention time must be located in [rtmin, rtmax] in the peak annotation table (step 1); use correlation structure of top ranked peaks so that highly correlated peaks (r > 0.9) can be annotated together, with co-eluting peaks often assigned as fragment ions (step 2); extracted ion chromatogram (EIC) of m/z 697.1593 ± 20 ppm was retrieved from a sample with strong peak intensity, the average mass spectrum was constructed from each individual peak (step 3). Here the mass spectrum of peak 1 at 4.15 (249 s), with co-eluting ions m/z 287.05, 449.11, can be annotated as K-Glc-maGlc. Peak 2 is an isomeric peak of CP697.1593_4.15, with characteristic ions m/z 287.05, 449.11 and 535.11. The presence of m/z 535.11 (–86) further suggests the presence of a malonyl group in the molecule.

