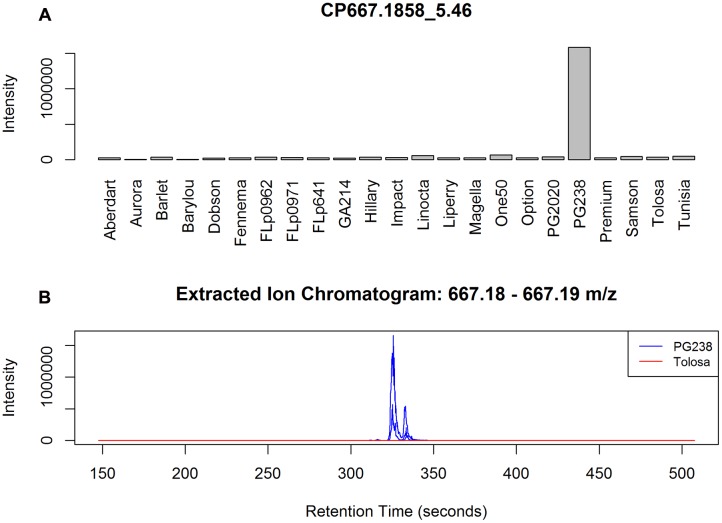
FIGURE 4.
(A) Example of a PG238 specific peak CP667.1858_5.46, annotated as I-acGlc-Rha. The barplot is based on the median averaged peak intensity of all the samples from the populations. (B) EIC plots of three randomly selected data files from PG238 and Tolosa, respectively. Chromatographic peaks, although shifting, are well formed in PG238 samples but no signals detected from Tolosa samples.

