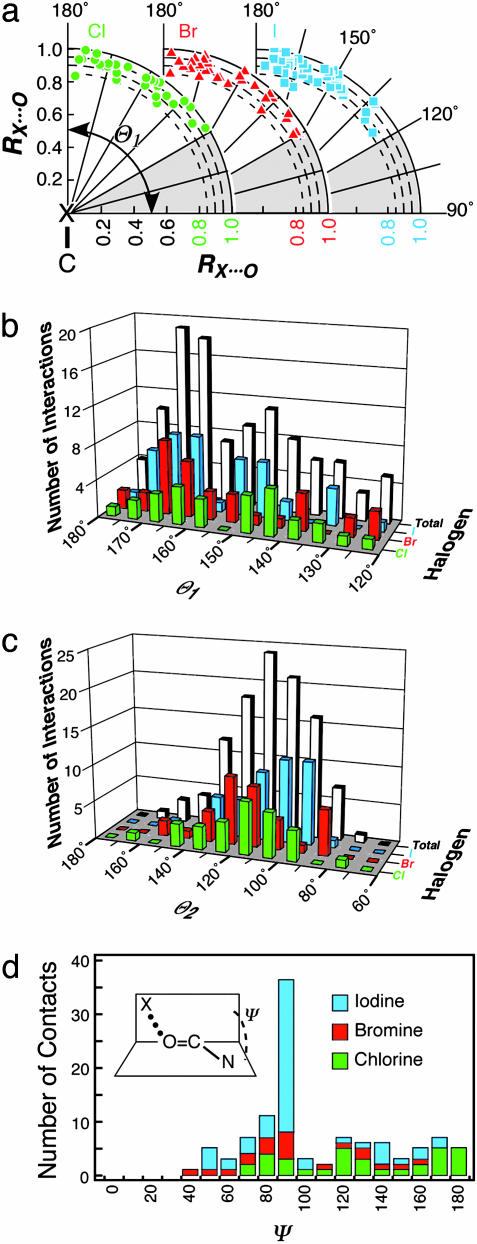
Fig. 3.
Polar scatter plot and histogram distributions for halogen bonds. (a) Polar scatter plot relative to Θ1 and the normalized halogen (X) to oxygen distances (RX···O, where RX···O ≤ RvdW) are plotted for X& Cl (green circles), X
 Br (red triangles), and X
 I (cyan squares). Both the x and y axes of the plot represent RX···O, with the y axis aligned along the C
 X bond (180°) and the x axis perpendicular to the C
 X bond (90°). The shaded region from 90° to 120° indicates the Θ1 angles that were excluded from our data set. (b) Histogram distribution of Θ1 angles. The number of short X···O interactions to chlorine (green), bromine (red), and iodine (cyan) halogen atoms, and their sum (gray) are counted and placed into 5° bins of Θ1 angle and plotted as a 3D histogram. (c) Histogram distribution of Θ2 angles. This plot is similar to b, except the interactions are placed into 10° bins of Θ2. (d) Histogram distribution of the dihedral angle Ψ calculated for short halogen bonds involving the O
 C group of the peptide backbone.

