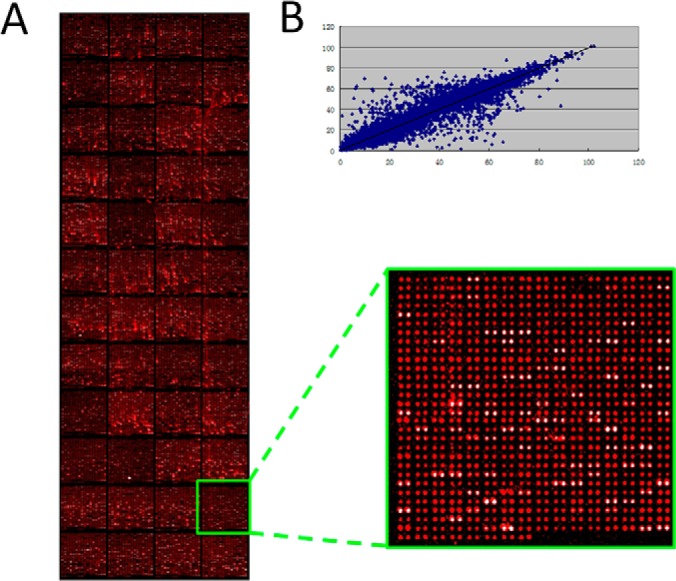
Fig. 2.

Quality control of HuProt arrays. A, The left image was the full view of a representative HuProt array detected with anti-GST signal. Statistical analysis shows 93.2% human proteins were detectable. There are 48 blocks on each microarray, and a magnified image of one of the 48 blocks on the HuProt array is shown on the right. B, The correlation coefficient between duplicate spots for each protein was determined as 0.978, suggesting a high reproducibility (Y = 0.99X + 0.53 R2 = 0.96).
